
Recession outlooks


There are two main approaches helping to understand and determine price of assets. Narrower is microeconomics, which focuses on analysis of markets, entities, politics, government, legislation, demand/supply etc. Other is macroeconomics, which looks at economy as a whole, dealing with such aggregate phenomena as growth in total output and living standards, business cycles, inflation, unemployment etc. Right now both tell us, good times are gone.
What is the dreadful R-word?
Recession seems to be least likeable word in official’s vocabulary, both financial and political. No one wants to be associated with such, as this would compromise possibility of re-election or to be offered board seat or advisory contracts at the end of political career. Especially since understanding of economics and finance by general population is poor. Hence, elected official may be perceived accountable for predecessor’s mistakes.
But how exactly one could describe recession? US Fed defines it as significant decline in general economic activity extending over a period of time. During recessions, unemployment increases and real income decreases. Other, slightly different definition says that recession is a significant, widespread, and prolonged downturn in economic activity. A common rule of thumb is that two consecutive quarters of negative gross domestic product (GDP) growth mean recession, although more complex formulas are also used to make determinations.
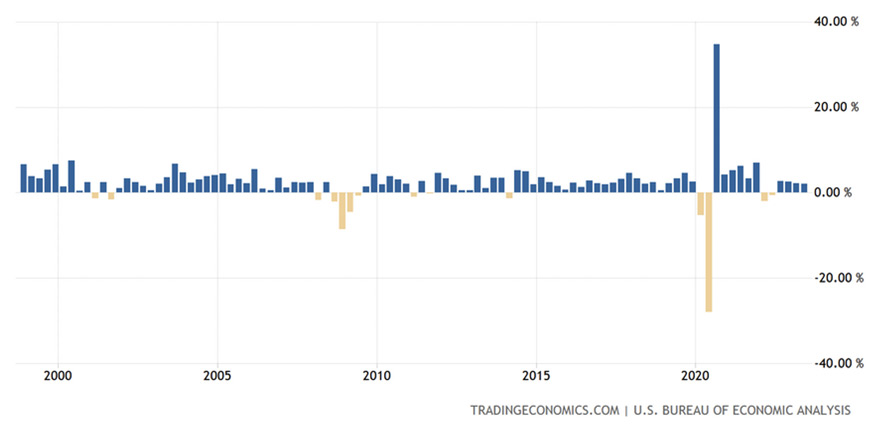
US GDP Growth Rate for last 25 years. Source: https://tradingeconomics.com/united-states/gdp-growth
Above caused lot of discord in 2022, as USA actually hit two consecutive quarters of negative GDP growth, however recession has not been announced. At a time media discovered that in United States it is eight economist of National Bureau of Economic Research (NBER) who decide if economic conditions matured to the point requiring naming them appropriately. What is ridiculous, on this occasion some media focused on ‘lack of racial diversification’ narrative.

Fragment of CNN’s article from 28th July 2022 about technicalities on recession. Source: https://edition.cnn.com/2022/06/30/economy/recession-economists-nber/index.html
NBER economists measure recessions by looking at variety of indicators, going far beyond simpler and not accurate definition of two quarters of negative GDP. However they indicate that there is no fixed rule about what measures contribute information to the process or how they are weighted in final decision.
Fundamentally, we could say that an economic recession is a macroeconomic phenomenon in which rate of economic growth is significantly halted. In other words, it is a period of stagnation in the economy. Recession is embedded in the course of the economic cycle. Term is used to describe its first phase. This is when a reduction in the degree of economic activity is seen as a reduction in the rate of growth of gross domestic product (GDP). In turn, there is no absolute decline in gross domestic product, which is already referred to as a crisis.
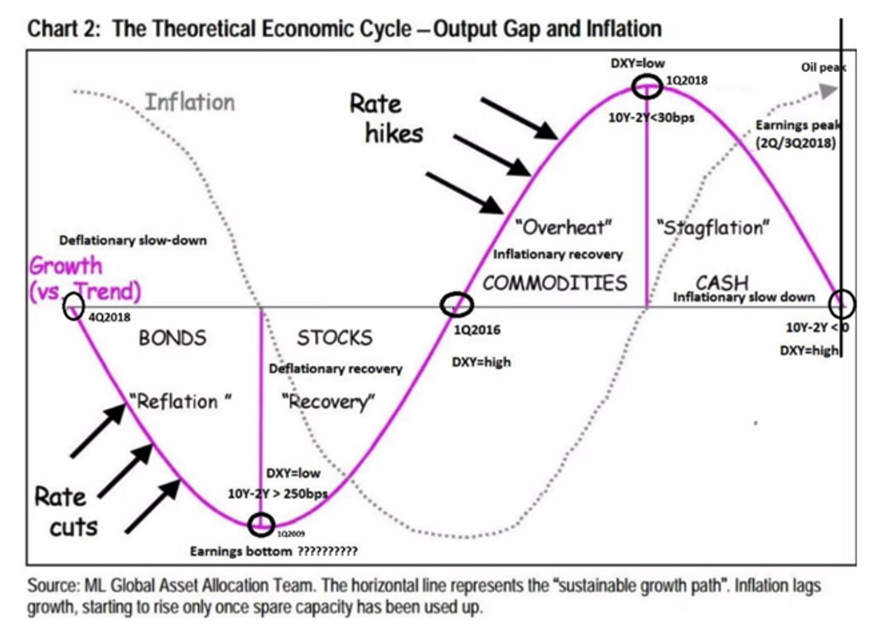
Theoretical economic cycle. Bear in mind, that these are not equal in time periods. Source: https://www.pinterest.com/pin/59250551328754520/
It has number of consequences for the economy as a whole, as it leads to a decline in overall activity, especially domestic production and employment. Main problem is lower levels of labour productivity. The effects of a recession are stunted growth or even a reduction in real wages, profits and other incomes among population. In addition, rate of growth decreases, capital expenditures fall, there is a slowdown in price growth, while unemployment rises. Decline in internal and external demand and the decline in the number and volume of investments translate into a slowdown in consumption. It is also worth knowing what follows a recession. When domestic production stops falling and unemployment rises, the bottom of the economic cycle is reached. If gross national product, begins to rise, economic recovery follows. The economic cycle ends when the recovery phase reaches its peak.
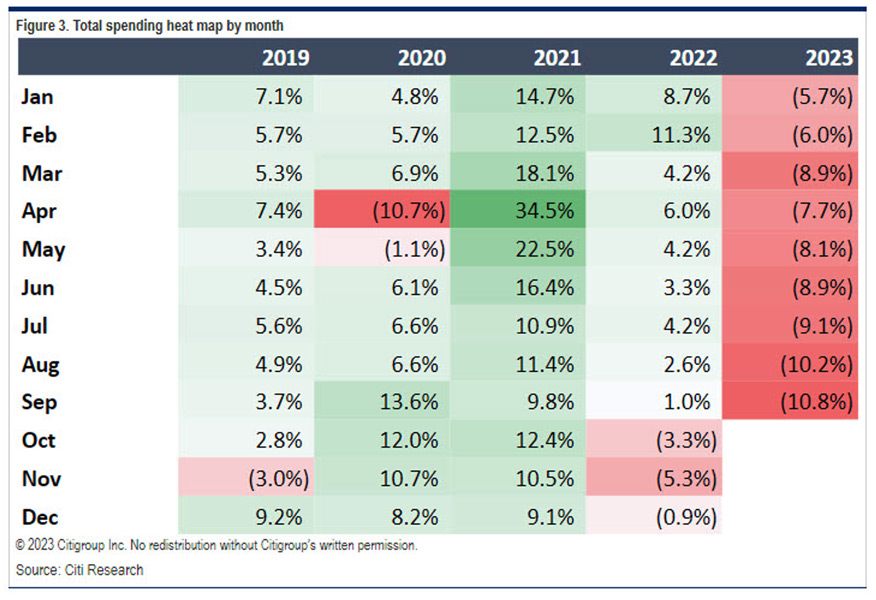
Did consumer spending in USA in USD just hit brick wall? Source: https://www.zerohedge.com/economics/consumer-just-crashed-credit-card-spending-unexpectedly-cratered-september
According to Moody’s, we’ve entered 2023 with 50% chances for recession to occur. Later on, these fell to approx. 30%. However St. Louis Fed implied with beginnings of September 2023 that chances for recession are at 50% within 12 months.
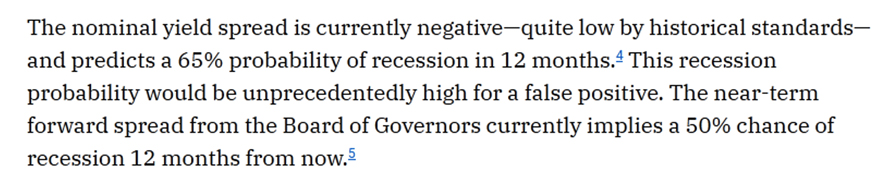
St. Louis Fed on probability of recession. Source: https://www.stlouisfed.org/on-the-economy/2023/sep/what-probability-recession-message-yield-spreads
Investment chiefs at BlackRock and Amundi investment funds speak in the same tone as St. Louis. Probably because both are be bond-heavy, hence experienced some loss. Their voices are however against market consensus expecting “soft landing”. Just in September 2023, Goldman Sachs cut its probability estimations on recession in USA to 15%. Survey by Bank of America made among global fund managers, shows ¾ expect soft landing or no downturn.
Gigans inter pares (lat. Giant among equals)
Let’s just focus in more detailed way on United States. US GDP as a share of world GDP stood at 25.2% in 2022.
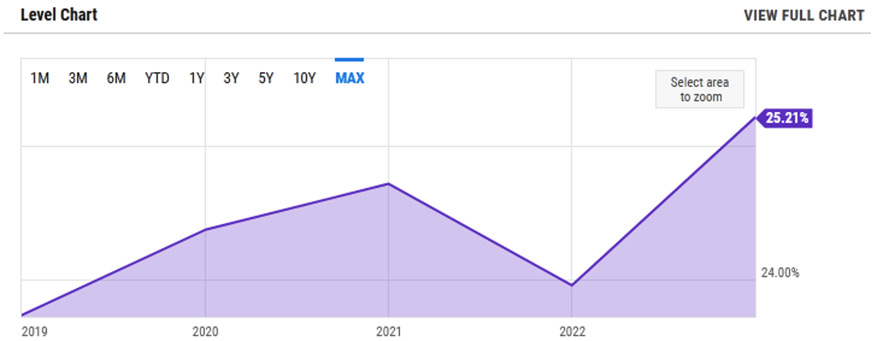
US GDP as % of World GDP. Source: https://ycharts.com/indicators/us_gdp_as_a_percentage_of_world_gdp
US equity markets are largest in the world and continue to be among the deepest, most liquid and most efficient, representing 42.5% of the 108.6 trl USD global equity market cap in 2023. That is 46.2 trl working under stars and stripes banner and 3.8 x next largest market, which is combined EU. US global market share has averaged 38.8% over the last 10 years with lows at 36.6% in 2015 and is locally peaking currently at 42.5%.
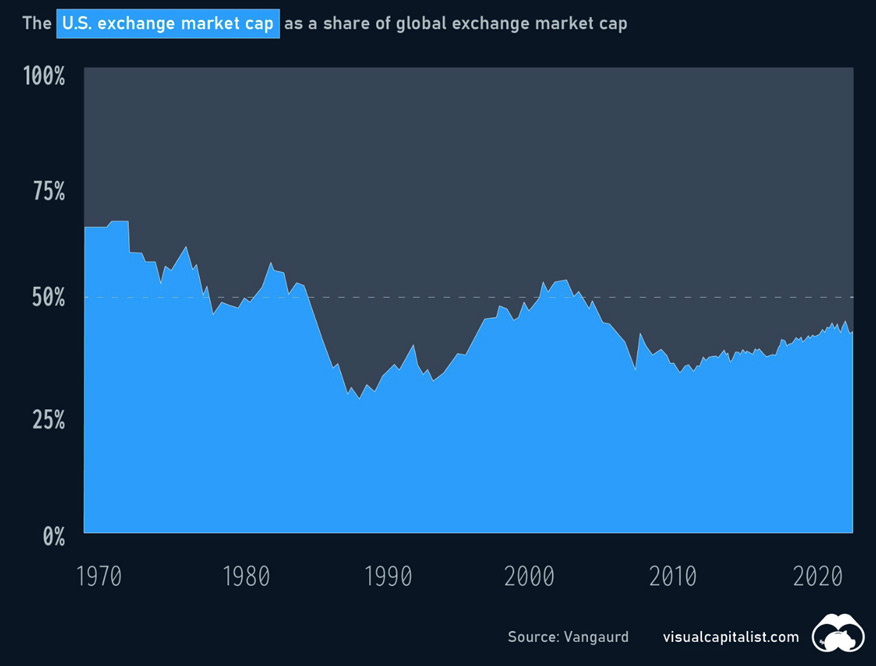
US exchange market cap as a share of global exchange market cap. Source: https://www.visualcapitalist.com/global-share-of-us-stock-markets/
Of course someone could say - US held over 50% of market share in 1970, and around 2000. Considering however natural growth, but also liquidity injections and capital flows, nominal capitalisation at 2023 is couple times larger than the past, even despite lower percentage share.
Continuing on exchanges – USA asserts its worldwide dominance having secured two top positions by capitalisation. As per June 2023, 2nd largest US stock exchange – Nasdaq – dwarfs threefold Shanghai and Euronext (consolidated Amsterdam, Paris and Brussels).
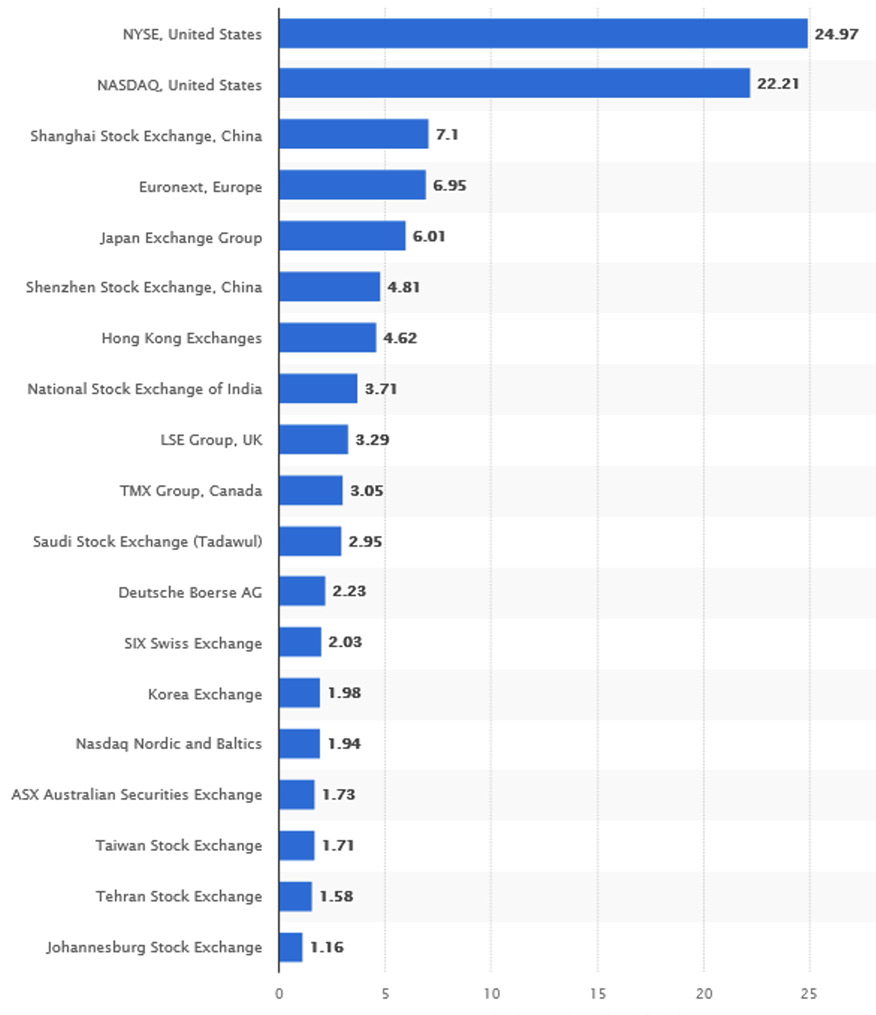
Largest stock exchange operators worldwide by market capitalization of listed companies (in trillion USD). Source: https://www.statista.com/statistics/270126/largest-stock-exchange-operators-by-market-capitalization-of-listed-companies/
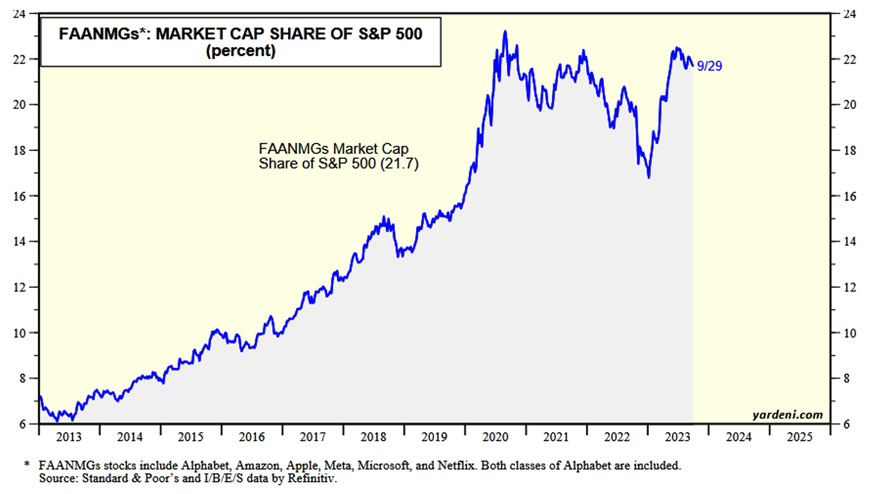
But it’s not everything – SP500 index (Standard & Poor's 500 Index, is a market-capitalization-weighted index of 500 leading publicly traded companies in the USA) itself has market cap of 35.8 trl USD. And its growths are being driven strongly by FAANMG (Facebook/Meta, Amazon, Alphabet/Google, Netflix, Microsoft), responsible altogether for 22% (or 9 trl USD in nominal value) of whole SP500 market cap. These equities are the reason why SP500 made growths this year, but due to the size they may also act like stone chained to the ankles. Just Apple itself, having 2.7 trl USD market cap after recent declines surpasses Frankfurt Exchange!
There are however higher values to consider. Like global bond market valued in 2022 at 133 trl USD in total. And fact that some part of non-USA made bonds were issued in USD, adds additional weight to equation.
IMF informs on 2023 Global Debt Monitor that at the end of 2022 global overall debt declined and equals 238% of world’s GDP, or 235 trl USD in total. Again, USA’s position seems to be ascertained on some charts, however China follows and surpasses on some.
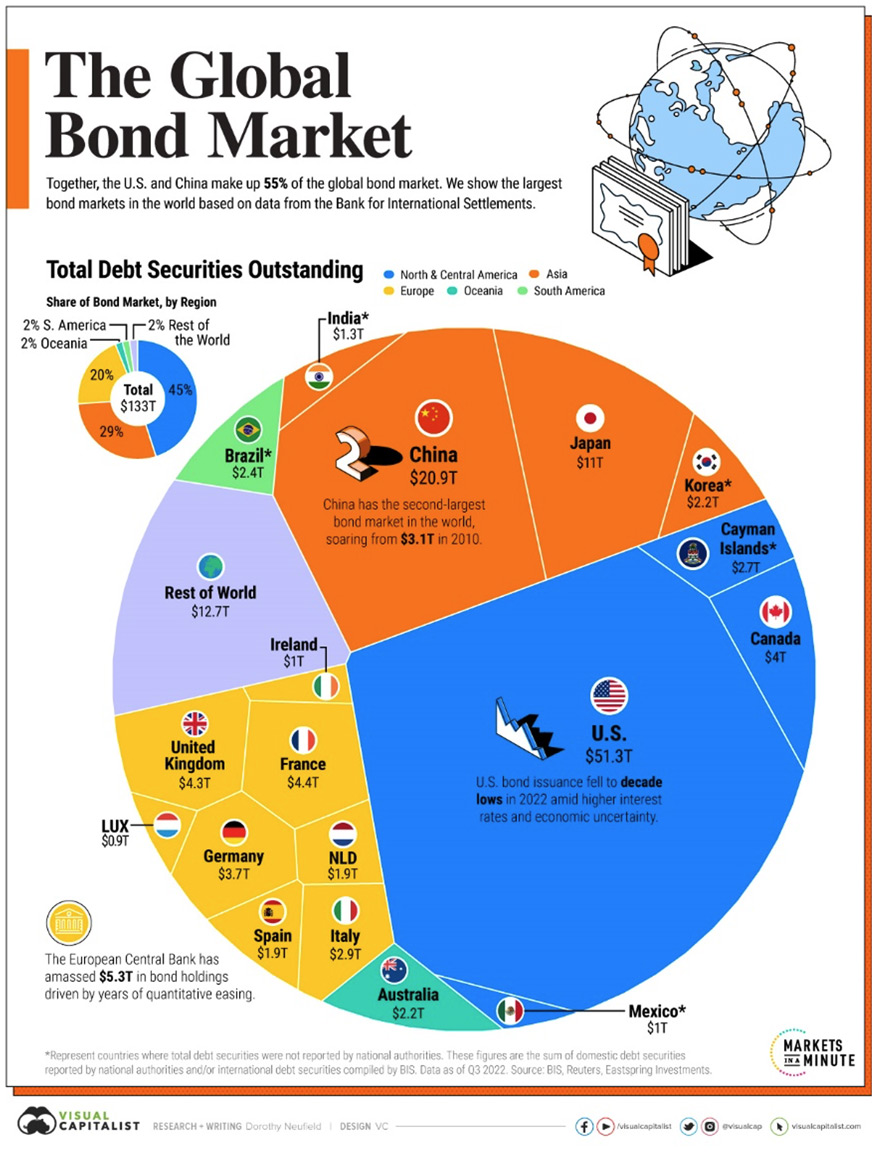
Global bond market 2022. Source: https://www.weforum.org/agenda/2023/04/ranked-the-largest-bond-markets-in-the-world/
IDebt market is not even most important market by market cap, as we still have consider real estate. That globally is at nearly 380 trl USD. And although China retains its position as world’s most valuable real estate market (home to 1.4 bln people after all), USA with 331 mln remains accountable for 19% of its share.
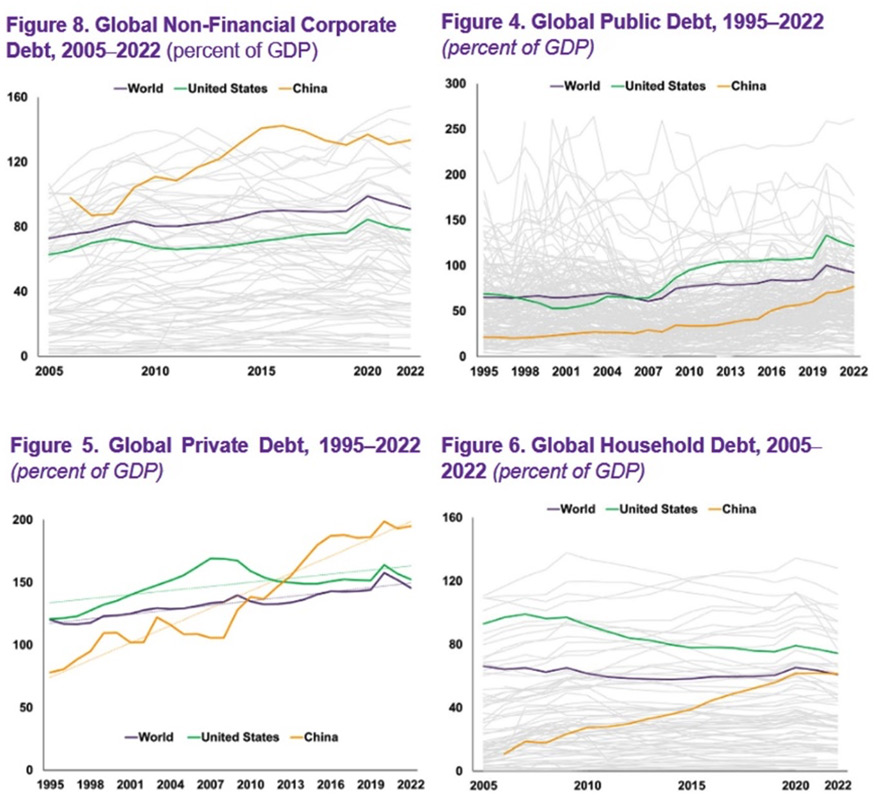
Global debt as a percentage of GDP. Source: Compilation of charts from 2023 Global Debt Monitor
Debt market is not even most important market by market cap, as we still have consider real estate. That globally is at nearly 380 trl USD. And although China retains its position as world’s most valuable real estate market (home to 1.4 bln people after all), USA with 331 mln remains accountable for 19% of its share.
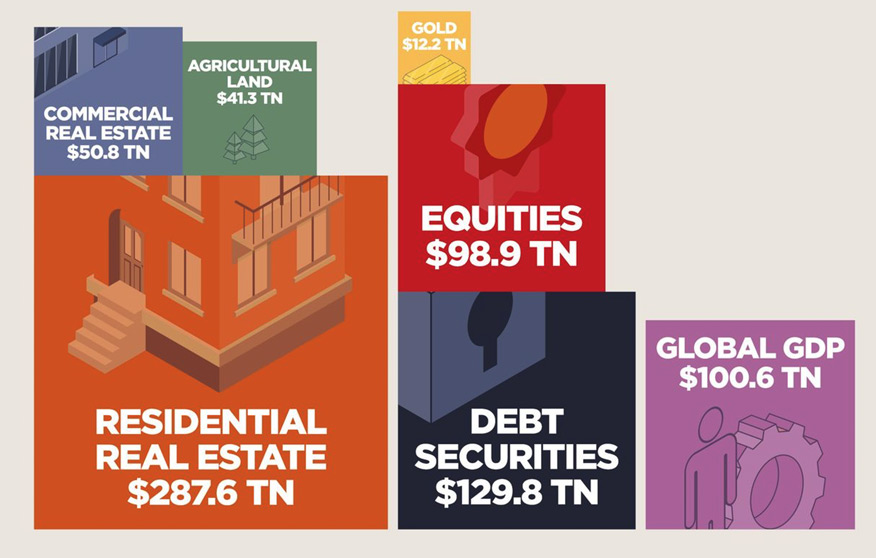
Global real estate universe 2022. Source: https://www.savills.com/impacts/market-trends/the-total-value-of-global-real-estate-property-remains-the-worlds-biggest-store-of-wealth.html
Please note on this occasion capitalisation of gold market.
Significant real estate wealth is concentrated in Europe and North America. Value of property in these two regions accounts for 47% of the total value worldwide, despite them being home to just 17% of the global population. Asia-Pacific (excluding China), by contrast, has 37% of the world’s population but accounts for only 17% of global real estate value. USA itself is responsible for approx. 50 trl USD in value on residential real estate and approx. 15 trl USD in commercials.
Of course we have to take under consideration housing bubble, especially visible during last years in Toronto (Canada), London (UK) or California (USA).
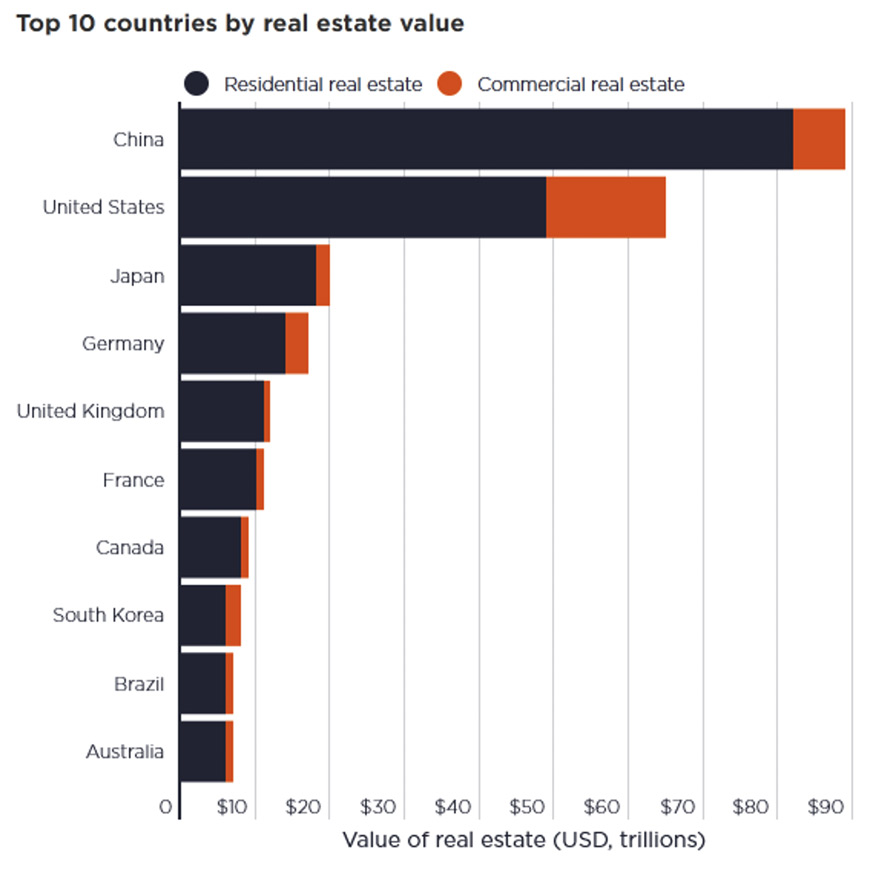
Top ten countries by real estate value. Source: https://www.savills.com/impacts/market-trends/the-total-value-of-global-real-estate-property-remains-the-worlds-biggest-store-of-wealth.html
On this occasion we should also address derivate global market cap, but its size is dependent on measurement basics – by gross market value and by notional value. But we’re talking about 18.3 trl gross (22 trl according to different sources) and 632 trl in nominal value according to BIS. North America is accountable for 30% of above.
June 2022 derivatives market by notional value according to BIS. Source: https://www.bis.org/publ/otc_hy2211.htm
What is the conclusion then? USA is solely responsible for large piece of global financial market, acts as largest in size economy, and only at some statistics is being surpassed by Asia / China.
So what really to think on the above? Due to sheer size of US economy and financials, numbers simply imply, had USA sneeze, world would catch severe cold. And especially Europe – bonded heavily to USA.
We’ll have recession / We won’t have recession (delete where not applicable)
Just recently Fed claimed to have a non-recessionary environment in 2024. However, as mentioned before, according to certain notable entities, data point differently. So who’s right? This cognitive dissonance reminds us on words of Georg Wilhelm Friedrich Hegel:
‘If theory does not agree with the facts, so much the worse for the facts’.
After two quarters of GDP negative growth, Wall Street became recessionistic - which turned out to be too bearish at a time. They assumed, economy will weaken upon bank crisis, which we experienced in March 2023. However Q2 macro data on employment etc. generally wasn’t bad. This made Wall Street to change sentiment again, this time to ‘no recession’. Even despite clear slowdown. Now, with refreshed bullish sentiment and improvement on macro data, optimism appeared. SP500 reached 4600, which was an important level. Since then it lost 8%, market is being oversold, sentiment slowly leans towards cautious. And macro data which previously boosted optimism so much, short term it may look ok, but long-term – tells story of economy materially slowing. Wall Street of course did seek any positives to fuel growths, even if it was to be led just by FAANMG equities. On this occasion it decided to ignore Fed, who clearly indicated need to maintain elevated interest rates for a period of time. ‘Elevated plateau’, sounded to Wall Street like ‘we’re cutting very soon’, which translates to cheaper credit and liquidity improvement.
And this is the important bit. Over-leveged companies see revenue drop. There is growth on debt, spike in defaults and deep shrank liquidity as credit conditions worsened. As US (and not only) economy is driven by credit – both government and corporate. What always precedes recession is tightening lending conditions. Large companies may issue and bonds or dilute them, hence raise capitals, and good credit ratings supports this. However smaller companies are dependent to banking loans. So credit conditions tightening makes gathering capital difficult, as banks increase spreads. As a part of cost cut strategy, companies do seek for savings, strategic investors, dilute shares, but eventually macro environment affects their capabilities to make investments and keep employment levels.
How to deal with above outlook? Here lies cognitive problem between Wall Street and Fed lies in different nature. Wall Street tries to predict future to create profit. But Fed base their decisions on data which is couple months old. It is simply an effect of function and definition of central bank – they gather data, and act accordingly to it. Of course they do predictions, mostly long-term, however central bank’s role is to respond based on past readings. And Fed really sticks to that as it wants to avoid mistakes made in the 70’s. That is pushing brakes too hard and causing recession in result. Then reversing its policies, causing in return high inflation.
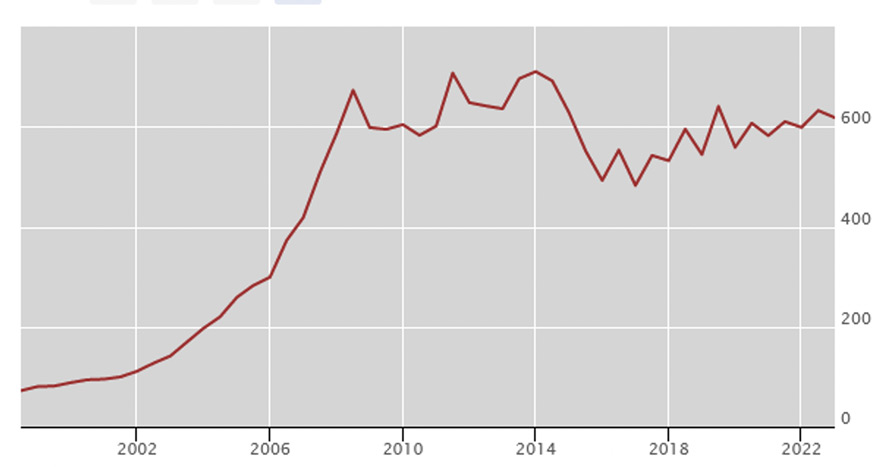
Currently, inflation readings of CPI seem to be most closely followed indicator by Wall Street. US CPI is down from 9% to 3%-ish, which is close to Fed’s assumed targets. However US central bank operates with 2-3 years perspective in mind, ignoring short term. Hence we may still see inflation growth, due to delayed base effect, fuel prices and seasonality. Also, inflation is an effect but not the cause itself. So to have it defeated, Fed aims to slow down US GDP under 2% for extended period of time – few quarters. These are words of Chair Jerome Powell himself. However both Fed and Congressional Budget Office see long-term growth potential of economy at around 2%+, hence Fed needs to actively influence economy this way or another.
US CPI readings. Source: https://www.bls.gov/charts/consumer-price-index/consumer-price-index-by-category-line-chart.htm
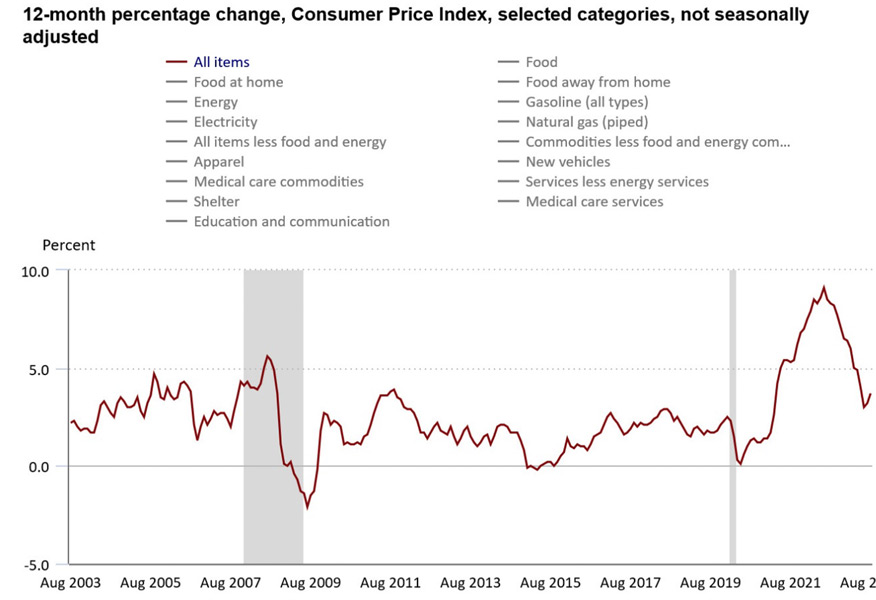
Another recession related indicator is growth of unemployment. With unemployment under 4% - which is 50 years low - Fed aims to make it grow. As an effect this would slack the economy (slash on GDP) and make wage growth to moderate (slash on CPI). Fed believes that achieving success on these two at the same time may ascertain, that upon eventual economy rebound inflation won’t grow as high as before, especially in earlier stage of recovery.
Unemployment risks in USA. Source; Bloomberg
Jobs are a lagging indicator, as companies initially look for cost cuts elsewhere. When it comes to employment, they aim on overtimes, bonuses, temporary staff, then eventually focus on headcount. In past years we could say we experienced employee market – as it was harder to find experienced staff, hence specialists had better opportunities to negotiate payroll and T&C. In addition, employment market experienced generational changes (Generation Z has higher expectations) and those caused by pandemic. This had slightly changed now, which especially is visible in financial, IT and automotive sectors. So as a result of macro changes and Fed policies, employment, which is lagging signal, will worsen on readings). For now, St. Louis Fed reported after Indeed employment website y/y decline in most of new job offer types. That will eventually impact monthly job numbers, and then we’ll start seeing job losses.
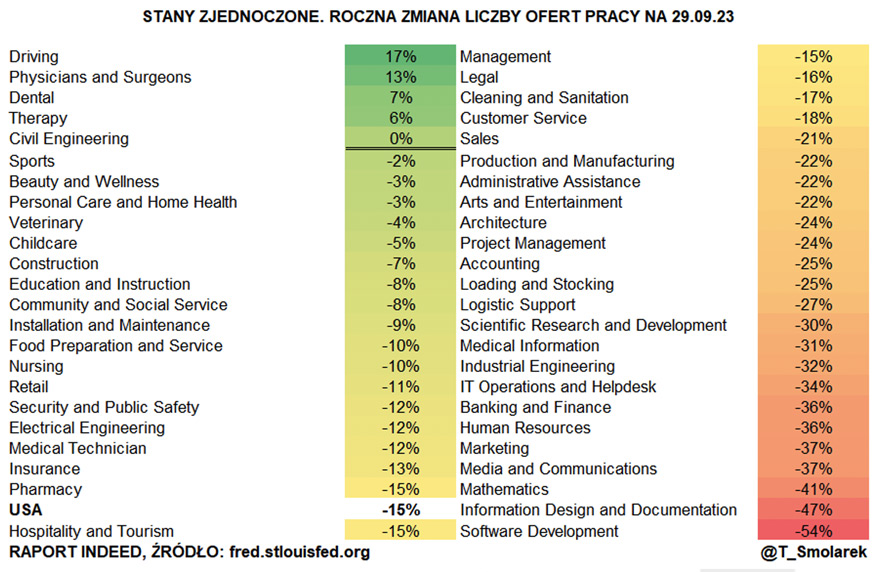
USA. Y/y change in number of job offers as on 29th Sep 2023. Source: https://twitter.com/T_Smolarek/status/1709943053061181554
As economy in credit environment is driven by liquidity, we have to observe growth on yield on treasury bonds. US 30y treasuries pay 4.8% and 10y 4.71% as on 5th of October. Yield on 10y is higher than in 2007. In March 2023, with yield on US 10y at 4% we addressed that on Metal Market Europe Blog our analysis of falling banks. And in the moment of writing these words, seems that UK’s Metro Bank doesn’t look very healthy.
Yield growth and banking insolvencies seem to be clear signal that behind-the-stage-liquidity-injections have or will have to be performed. Either directly or to entities overtaking / consolidating. And there are no technical signals for yield trend reversal in very near future. Although Bank of America just recently expressed view, that bonds are to rally big in 2024 amid recession and become best performing asset soon. As for now, long-term yield chart of US 10y shows, time of cheap credit is over. More of that – on treasury auctions, buyers are unhappy with yield offered by officials, and bid for higher. Needless to say, that downgrade of US treasuries performed by Moody’s summer 2023, didn’t help in maintaining US bonds stability.
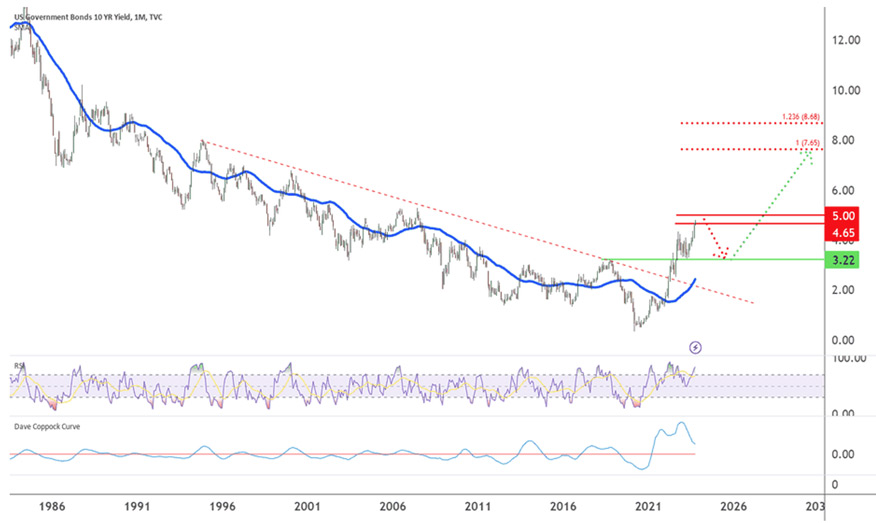
Credit crunch on example of long-term US 10y. Source: https://s3.tradingview.com/n/NKttR50U_mid.png
At the same time, sell-off of bonds issued in the past intensifies. Notable example is China. Growth in China is slowing for cyclical and structural reasons, and Chinese direct exports to the US are lower. As a result, China has fewer dollars to recycle into Treasuries. In fact, China has been selling $300 billion in Treasuries since 2021, and the pace of Chinese selling has been faster in recent months. And lot of these were being purchased during time of near zero interest rates.
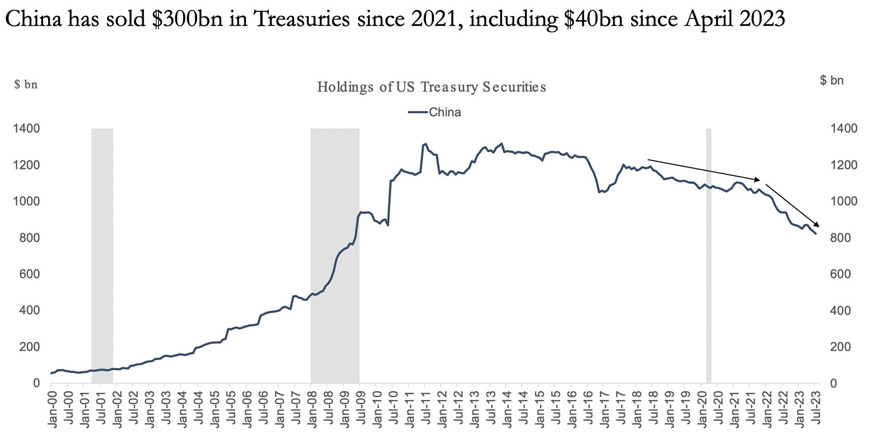
US bonds sell-off by China. Source: https://twitter.com/rditrych/status/1709845580095045890/photo/1
And these are not just US trends, but global in size. Japan is one of the notable exceptions but it followed slightly different policies in last decades. Considering USA, and especially due to USD role in the world (which we addressed in the past analysis), recession outlooks are various. But same could not be said for Europe, troubled by inflation, real negative interest rates, bound to expensive fuels from everywhere just not from McCains’s petrol station, and succumbing slowly towards capital controls and CBDC. Outlook for Eurozone seems to be much worse, and potentially mild recession in USA may locally in Europe turn onto something more severe. And by the way – we haven’t seen yet any debt rating downgrades on main EU economies since a while.
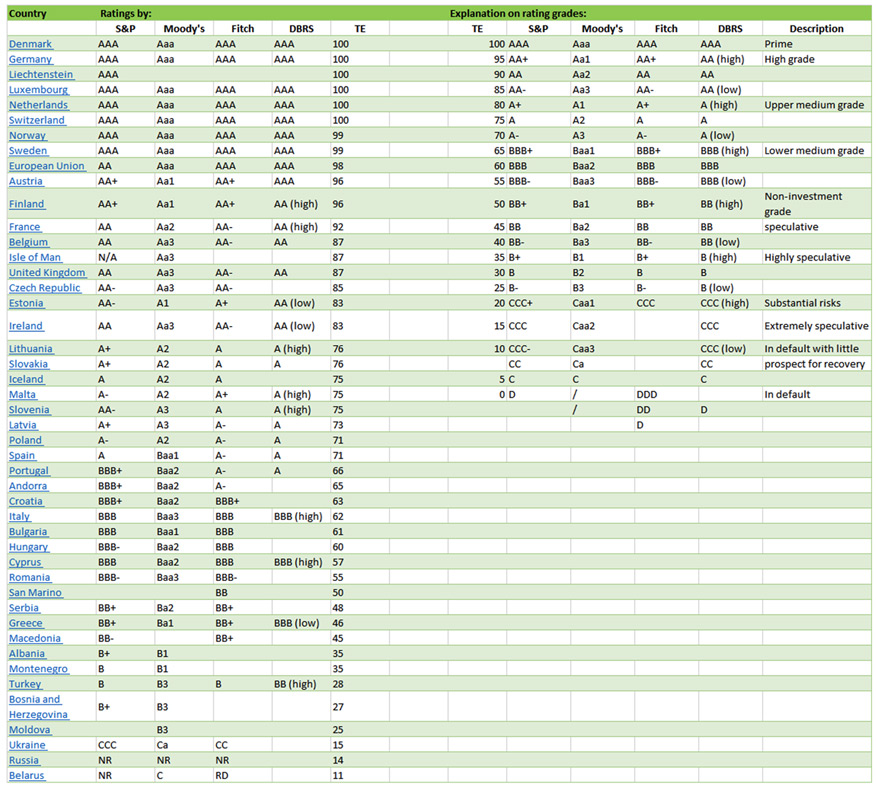
Debt ratings on EU countries. Source: Trading economics
So bond holders experience strong losses on value of held assets. Usually they do not have to report them live, these are being treated as unrealised losses. In other words – until you didn’t sell, you had not experienced loss. On paper my liquidity is 100, but in reality – would I have to sell them to raise capital – I’ll get i.e. 75-80. Numbers based on performance of US 20+ year bond ETF (TLT) w/dividends, reinvested, and adjusted for US inflation, show that losses may be even larger.
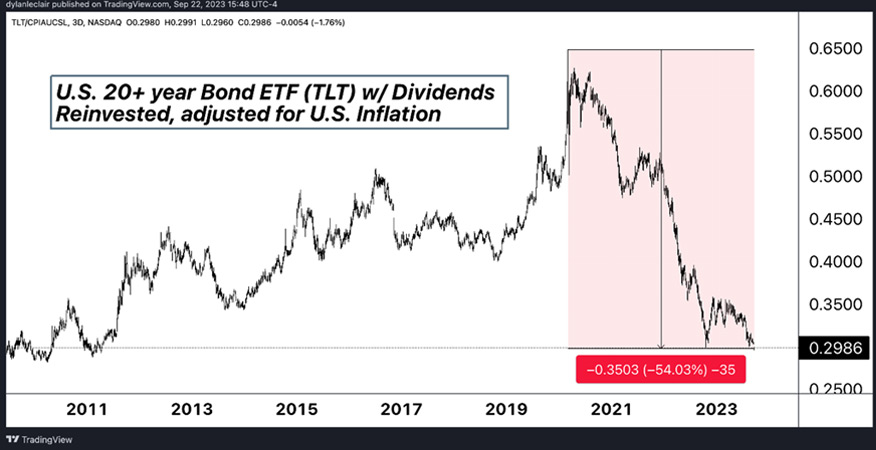
US 20+ year bond ETF (TLT) w/dividends, reinvested, and adjusted for US inflation. Source: Tradingview
Of course above description slightly distorts standard nominal approach, but fact that long-term bond holders experienced losses is simply undeniable. On this occasion we recommend checking financial positions of central banks around the world. Just couple years after they had released and kept purchasing i.e. bonds as a part of Covid recovery. This point itself – on central bank’s experienced losses - is meaningful in terms of liquidity and countries’ ability to increase debt. It doesn’t affect however existence of central banking as their policy mandates include price stability and financial stability, not profit maximisations. Also central banks are not subject to capital adequacy requirements or bankruptcy procedures and can operate effectively even with negative equity.
Many central banks experienced losses in 2022. Source: https://oecdecoscope.blog/2023/07/06/do-central-bank-losses-matter/
But this puts immense pressures on all other bond holders, which by the way are the most popular assets among pension funds, funds and investment banks. And as on this occasion appears that US treasuries became recently more volatile than gold. Seems that long decade of yellow metal purchases paid off. By the way, we’ll experience new records on central banks’ gold purchases in 2023.
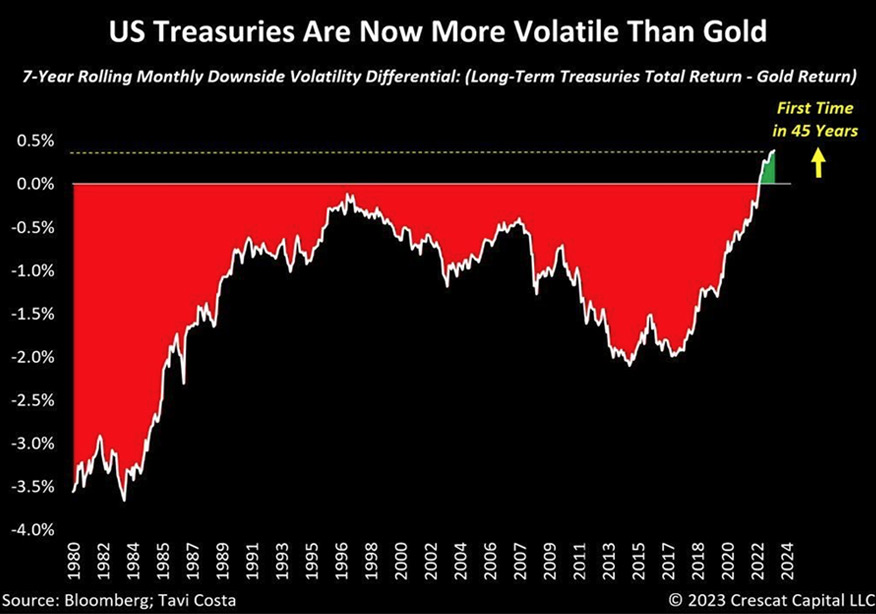
US treasuries became more volatile than gold. Source: https://twitter.com/tomaszwyluda/status/1706580232231092496
Yields at between 5.5-7% haven’t been seen since 2 decades. Now they seem to be real. Hence high yield and junk bonds may become trap and generate losses. What would it mean? In terms of equity market, SP500 on 3200-3600 range, is entirely possible. Especially since US treasuries are correlated to Dollar Index – DXY. Or at least they became such in last 2 years. Hence it is possible not to see rates down, until DXY itself would weaken. With current Fed interest rate at 5.50% it is possible to have few more hikes. JPMorgan Chase CEO Jamie Dimon says FED may be far from finishing aggressive moves, hence 7% is possible. That is very contrarian approach, especially if considers FED’s stance on ‘one more hike this year and cuts next year’. This however changes based on the outlook as just recently Fed discussed four cuts in 2024 and now it is claiming to do two. This outlook may mean further growth on treasuries yield, tightening lending conditions further, growth on unemployment and stronger dollar. Current tops on DXY were at 115. Since then we experienced correction to 99, then rise to 106 as we write these words. Upon DXY at lows we have seen stocks and gold rally, now we experience mean reversal. Of course DXY won’t grow in linear way as USD is now technically overbought, hence possibility for temporary pullback. Just to catch a breath.
But what also helps to ramp up dollar is crude oil. With prices at in between 80-90, or even at 65 USD plus, non-USD countries have to purchase more dollars to pay for its oil imports. Considering dollar is going up on fx pairs, this puts pressures over non-dollarized economies and builds up more demand for dollar, which is more expensive. And fuel is important component of cost trinity – labour, materials, overheads. Hence PPI and CPI growth i.e. in Europe.
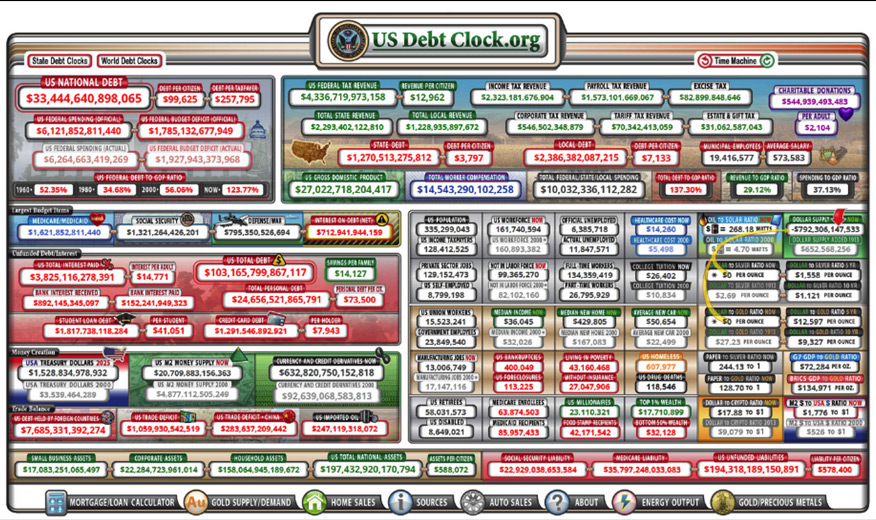
US debt data as on 04th October 2023. Source: https://www.usdebtclock.org/
Above contributes to growth of US debt. There are two main elements composing that. First is growth on yield (interests), that USA has to pay on emitted bonds. Selling treasuries by foreign banks ads to the yields. Other thing is they also sell dollars, to deliver capital in USD or gold back home (and i.e. sspend it for oil and other necessary imports). Normally that should weaken USD, however it doesn’t slow dynamic on DXY. So USA now pays more on interests, than it is paying on its defence – same defence that since years is nearly un-auditable and can easily and accidentally overstate tranche of 6 bln USD in military aid for Kiev.
Other pressure on treasuries lies in growing government’s expenditure. Currently approved US budget for Oct 2023 – Sep 2024 is 7 trl USD, which is 400-500 bln more than initially expected. USA will therefore easily jump from 2 to 3 trl USD on deficit, of which there is a large share dedicated to green energy transition. Being indebted is not a good thing. However governments act differently and spending actually helps economy. In current budget there are also some provisions to improve private spending, and to benefit from tax credits. Idea of increased spending stands in direct contradiction to what Fed tries to achieve. Hence we wonder is there a budget and fiscal primacy over monetary policies?
This trend won’t stop as USA is heavily engaged in bi-partisan political war over who’s going to reside in White House in 2024. So considering that USA has expenses, but also that quality of its ebt deteriorated for now, we may experience speed up on debt issuance. Which happened just recently by the way.
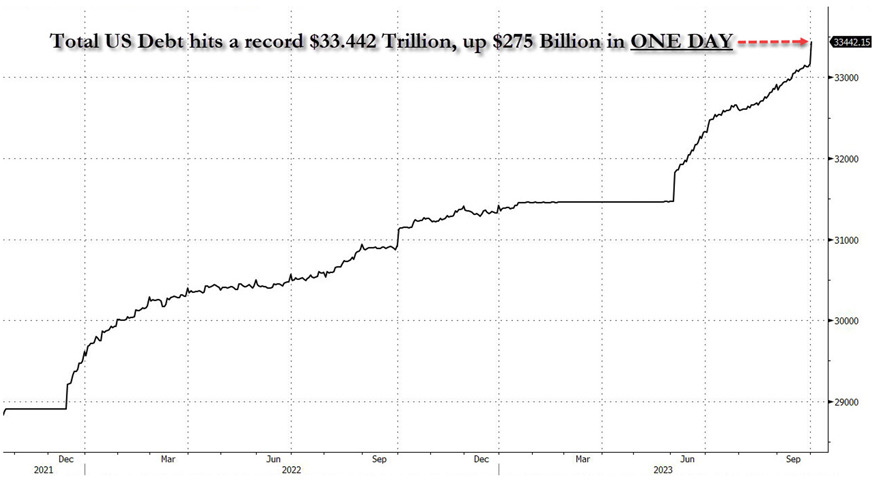
US adding 275 bln USD in debt just in one day, mid-September 2023. Source: Zerohedge
To conclude
Recessional outlook in USA seems to be realistic, although exponentially less severe than in case of EU. Just as it happened in 2007-2008, when USA managed to end crisis domestically pretty quick, but it did spread over the world, turning in Europe onto eurozone crisis. Question remains however would US is going to experience mild-recession or different in strength? It seems to be realistic approach to experience stock market going towards long-term secular bear market. But assuming macro data may not be that bad, then everything lies in market psychology. We observe worsening of date, read articles on recession. Increase of fear may increase selling, triggering potential drops which may trigger even bigger bear market. Current build up on equities was based on hopes that we’ll have no recession. However economic issues do develop, although often in lagged way. Of course analytical approaches may differ, as well as outlooks and abilities to read these. However let’s emphasize on this occasion that some serious effects already occurred - you do not raise interests to 5.50% in sharp moves without visible worsening of economic conditions. And of course we could mention that due to 2020’s helicopter money Americans still have excess savings, 8.7% in social security, low unemployment, and economy is incentivised by government spending – but all these elements may simply give false hopes of stabilisation.
To ascertain long-term profits over last decade, all you basically had to do is to keep stocks, which were to grow in value exponentially as it is natural state of things on stock market. Growths were additionally boosted by QT and Covid QT. Of course some were going faster and higher like tech stocks. On the other hand, bonds delivered fixed income. Low, as for majority of last decade US interest rate stood at 0.25%, but stable as they could’ve been disposed on secondary market at any time basically at face value. So last decade was supportive to investment portfolios composed of 60/40 proportion of stocks and bonds.
However now, we experience mean reversal and just sticking to above model won’t deliver anything but losses. Besides, most individual and professional investors nowadays, including many fund managers, haven’t had a chance to see real bear market and don’t know how to behave in such. Last bear in USA was experienced 2007 – 2009 and lasted for 17 months. It delivered serious issues to Asian emerging markets, Eurozone, and delivered -56% total decline on SP500.
Since then, we have been ‘overprinted’ by QE and Covid QE programmes. Now, for the first time since 1933 US money supply is contracting. And so, people do not understand how to behave on such choppy market.
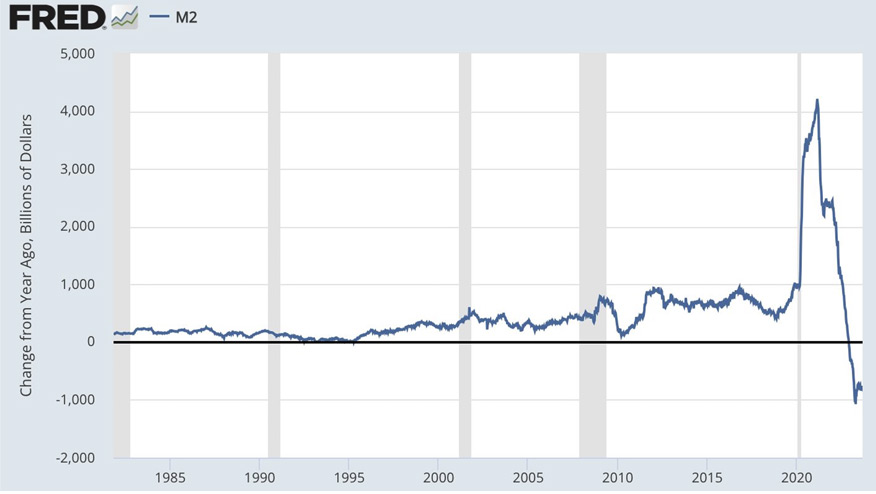
US M2 aggregate. Change from year ago in bln USD. Source: https://fred.stlouisfed.org
So, as always during recession, exposition to defensive assets like precious metals may seem to be good choice would we choose to protect our capital and purchasing power for future.