Has gold just surpassed Euro as central banking asset?


Dollar is king among assets held by central banks – no doubts about that. Until recently, currency of European Union maintained prestigious second position, however according to some estimations, it seems such just recently changed.
Gold as second most valuable central asset
Gold constitutes an important part of the reserves held by central banks. It is considered universally recognisable asset, liquid, free from political and economic influence of issuing body. Hence it is not to be considered as credit asset. And although not part of monetary system – which is based on fiat currency, debt expansion, controlled inflation and dominant usage of USD in trade balances – still bears significance. It has grown on importance since financial crisis 2007-2009, and further its role had been affirmed by Basel III - internationally agreed frameworks developed by the Basel Committee on Banking Supervision.
Long-term developments allowed gold to strengthen its position as a central banks’ asset. Current decade strengthen this process by adding portfolio of geopolitical tensions to the list of macro and, fiscal issues. Should therefore be not a surprise whatsoever to our esteemed readers, that central banks sucked part of golden liquidity off the markets. Fifteen consecutive years of net purchases peaked on 2022, when purchases amounted to 1082 t. net and in 2023 with demand at 1032 t. Price appreciation of approximately 500 USD that occurred since Q4 2023 to present slowed pace of purchases, however even partial 2024 data shows, that this didn’t discourage certain central institutions from expanding share of gold in their portfolios. It was predominantly global East and South that shown increased interest shown in gold ownership among assets held, but not only.
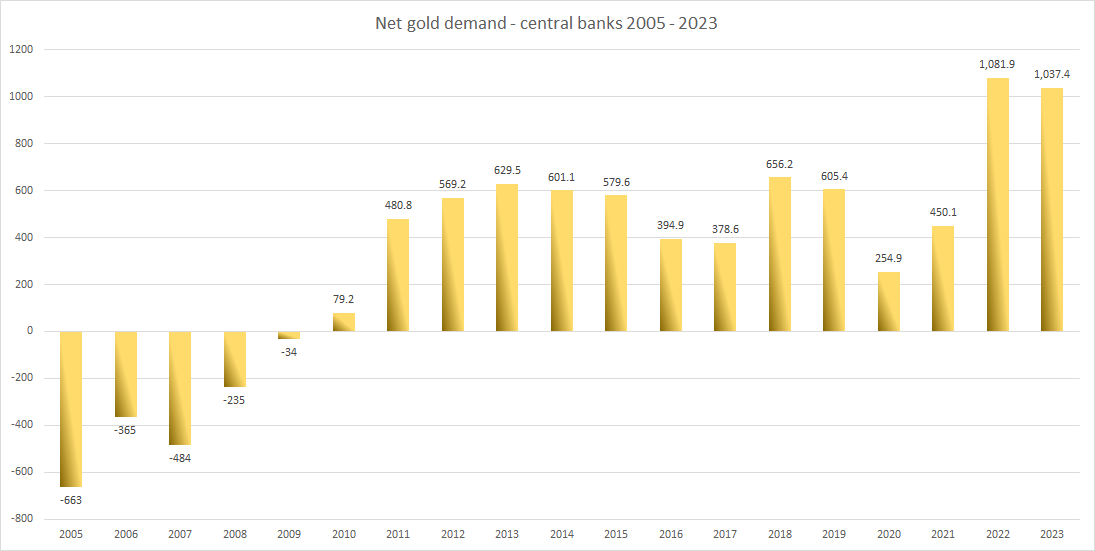
Net gold demand by central banks – 2005 – 2023. Compiled based on WGC data. Source: World Gold Council
According to the 2024 Central Bank Gold Reserves (CBGR) survey performed by World Gold Council (WGC), 29% of central banks respondents intend to increase their gold reserves in the next twelve months, the highest level observed by WGC since they began CBGR survey in 2018, and happening even despite recent price increases. Surveyed institutions also decided to share some data on reasons for gold purchases. And it seems that conservative approach of diversifier, hedge, performance, no default risk, historic position and liquidity, prevails.
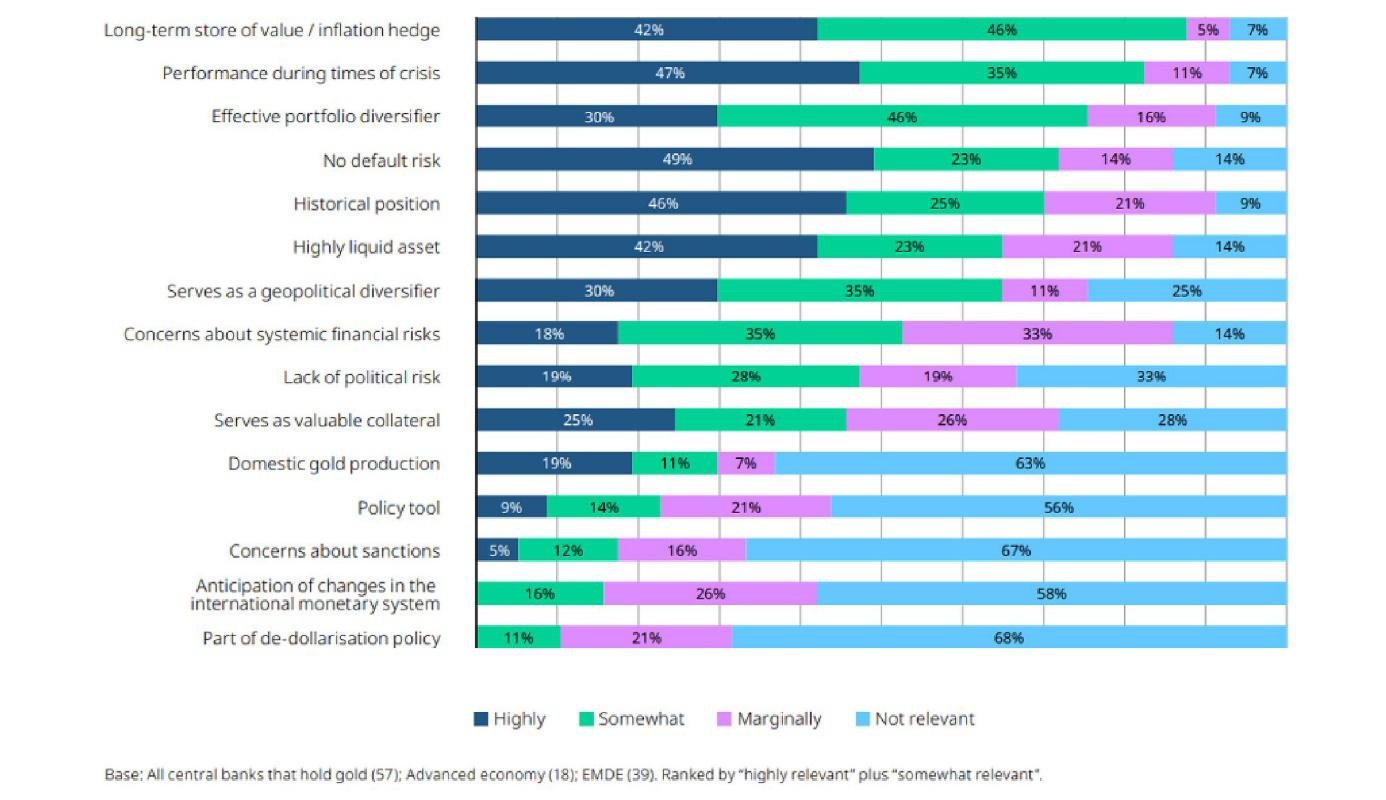
Reasons for gold purchases as per WGC’s CBGR. Source: World Gold Council
And on very interesting note, it seems that gold surpassed in 2023 Euro (EUR) in terms of value / percentagewise share among assets held by central banks.
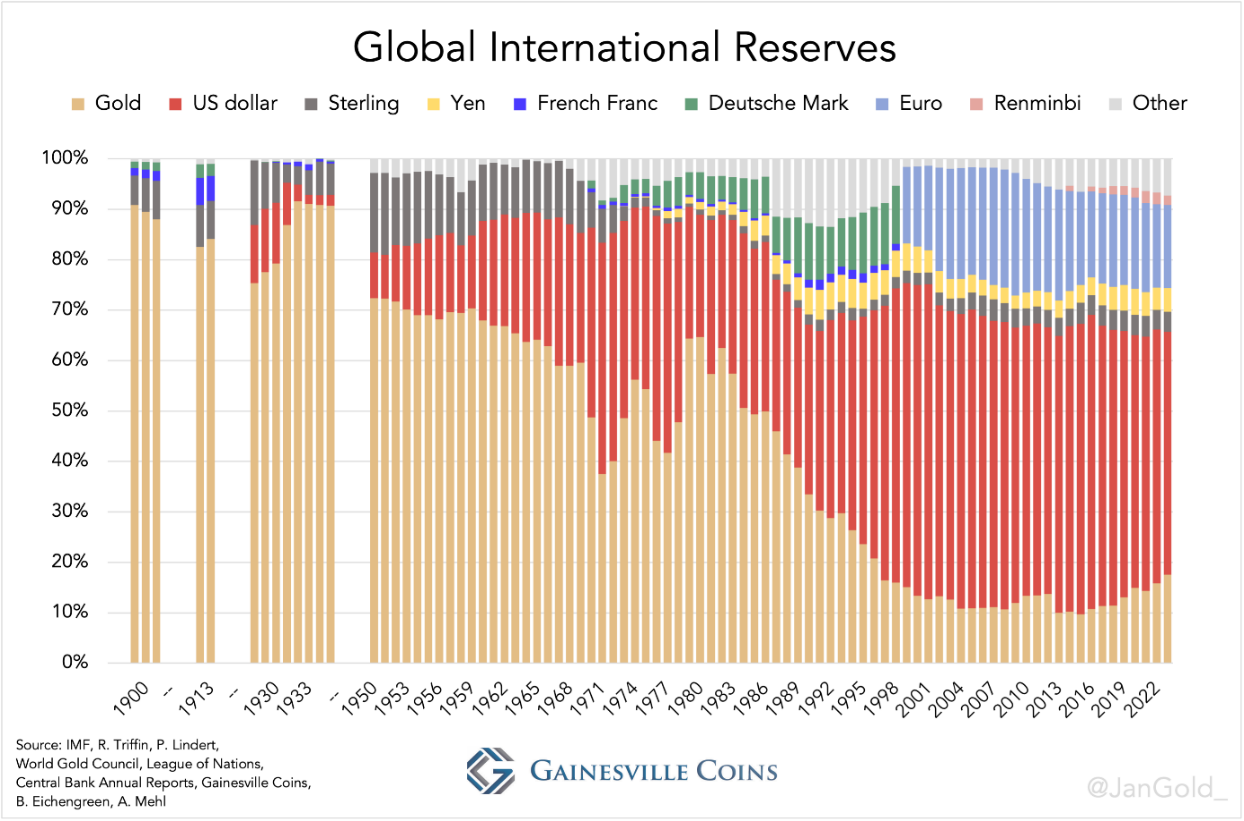
Composition of global international reserves. Source Gainsville Coins
This has been noted by precious metals analyst Jan Nieuwenhuijs of Gainesville Coins. In assumed methodology however, they admit to calculate world official gold reserves differently than International Monetary Fund (IMF). And so, take under account ‘unreported’ purchases made by China, Saudi Arabia, and other major buyers. According to the source, concluding 2023 USD constitutes for 48.10%, gold is responsible for 17.6%, while Euro for 16.5%, Yen 4.7% and Pound Sterling 4%, with remaining world currencies making remaining 9.1%. Evolution of such has been animated in form of video, published on X (formerly Twitter), that we link below:
• https://x.com/i/status/1793633879321899134
Different approach than one performed by IMF, causes some significant differences. So let’s take a look on IMF figures. As per end of 2023, IMF estimates in its Currency Composition of Official Foreign Exchange Reserves (COFER) above FX shares to be as follows: USD 54.22%, Euro, 18.55%, Yen 5.29%, Pound Sterling 4.49% and the rest, including unallocated at 17.44%,.

Currency Composition of Official Foreign Exchange Reserves (COFER) 1995 – Q1 2024. Data compiled based on IMF Cofer Database. Source: IMF
Above however constitutes only currencies and currency denominated debt, aka FX claims. Data presented b IMF therefore excludes gold. IMF’s International Reserves, Official Reserve Assets, Gold (Including Gold Deposits and, if Appropriate, Gold Swapped), SDRs, also provides inconclusive results, hence we can’t rely on IMF to tell us on gold’s share among central banks’ assets.
On IMF’s blog however, in an analysis dedicated to update on Dollar dominance in the international reserve system (published on 11th June 2024) we read following:
We also found that financial sanctions, when imposed in the past, induced central banks to shift their reserve portfolios modestly away from currencies, which are at risk of being frozen and redeployed, in favour of gold, which can be warehoused in the country and thus is free of sanctions risk. That work also showed that the demand for gold by central banks responded positively to global economic policy uncertainty and global geopolitical risk. These factors may lie behind the further accumulation of gold by a number of emerging market central banks. Before making too much of this trend, however, it is important to recall that gold as a share of reserves still remains historically low.
This information is being accompanied by below graph:
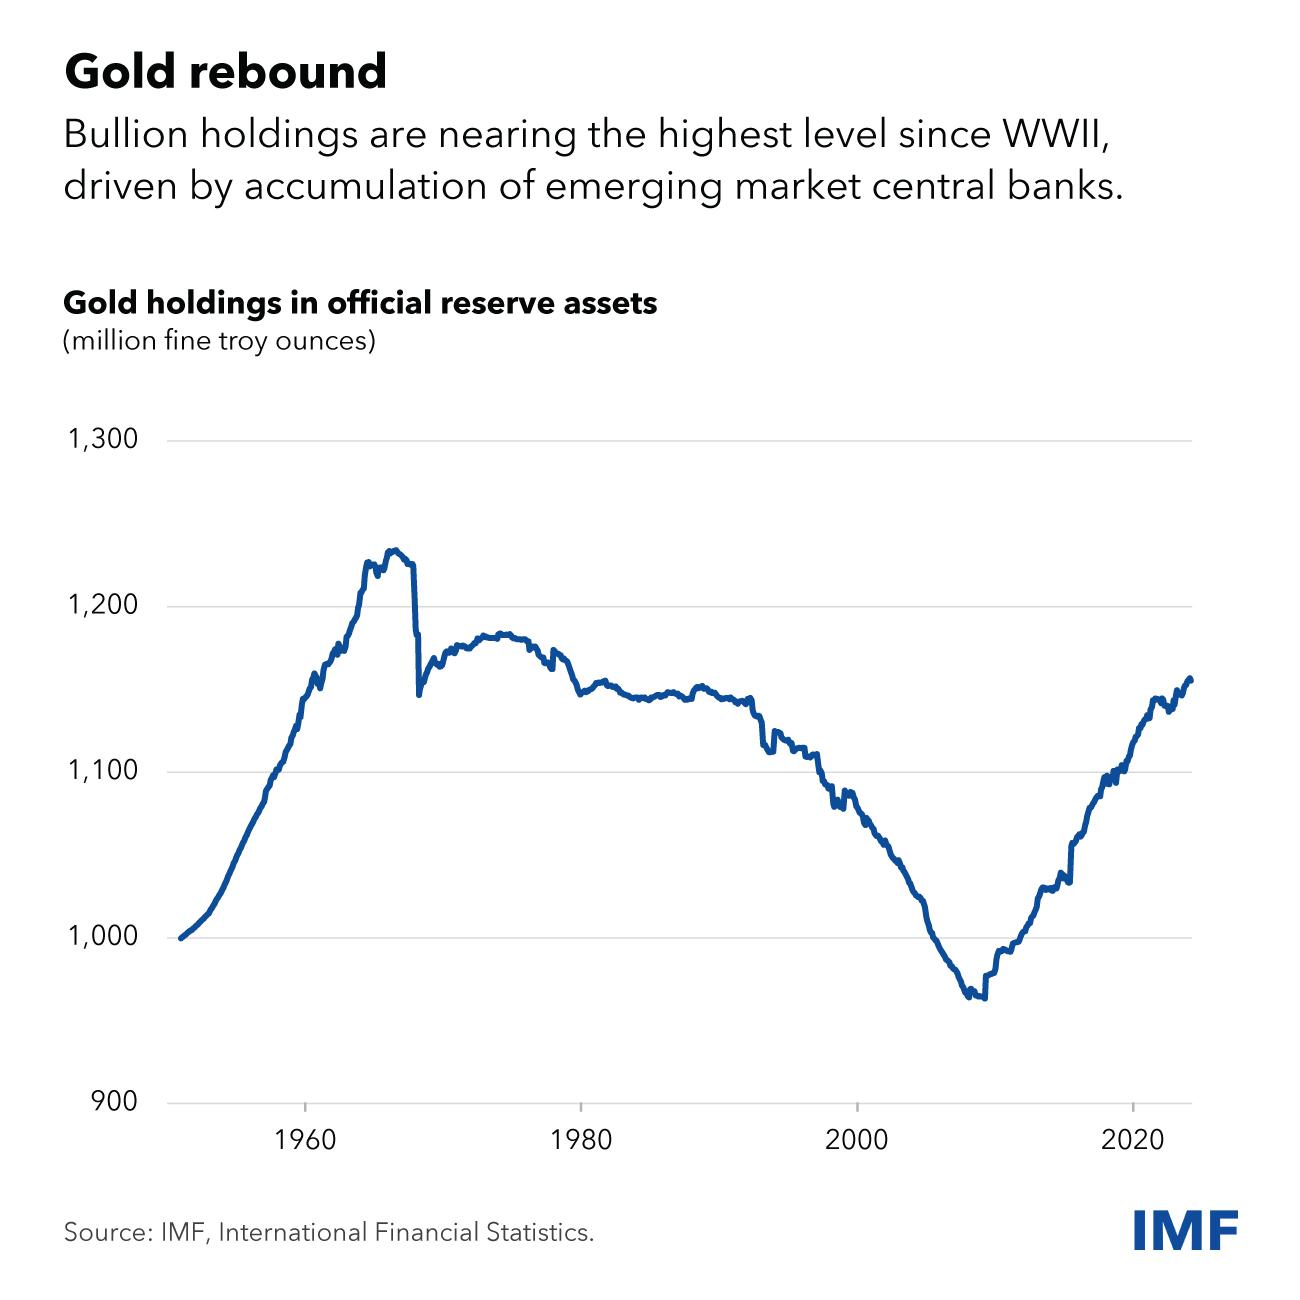
Official gold holdings on rebound. Source: https://www.imf.org/en/Blogs/Articles/2024/06/11/dollar-dominance-in-the-international-reserve-system-an-update
Above seems to be in line with WGC estimates for world official gold holdings. As per June 2024 these are reported at 36.2k t. globally. Dataset includes only official data, and so i.e. Mainland China’s PBoC is estimated to hold 2,26k t., which may be perceived as very conservative approach. Volume of 36.2k t. translates to 1,157,561,914 troy ounces. With estimated price per ounce at 2300 USD this is 2.6 trl USD in value. Ok, but IMF’s data reports FX claims as per end of 2023. This requires update in our methodology. From WGC’s data set we have to exclude official net purchases dated as 2024 so far, which is 166 t. Now, our assumed gold holdings would be at 36k t. just slightly rounded down That is 1,157,426,881 troy ounces at December 2023 closure price which is at 2,062 USD. Result is 2.38 trl USD as our total.
Above 2.38 trl USD worth of gold has to be compared against foreign exchange reserves reported by IMF. Figure concluding Q4 2023 for the currency of European Union stood at 2.28 trl USD at a time. But was it really Q4 2023 that marks EUR decline versus gold? Following assumed methodology, this time for Q3 2023 we have specifically 35,846 t. of gold, which is 1,152,475,666 troy ounces at September closure price which is 1848 USD, which results in 2.12 trl USD in gold, vs 2.14 trl in Euro.
And so, for end of 2023, according to our own checks, USD was at 45.4%, EUR 15.5%, gold 16.2%, JPY 4,42%, GBP at 3,78% and remaining currencies, including unallocated at 18.4% - slightly different proportions then those by Gainsville Coins, but with exactly same conclusion:
Dollar remains undisputed king, but there is now significant change on second in command.
Why we witness rise of gold vs EUR?
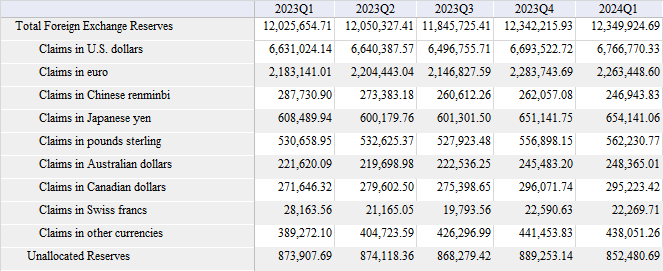
Currency Composition of Official Foreign Exchange Reserves (COFER) 2023 – Q1 2024. Source: IMF
Couple things contributed to such historic success of gold, we witness.
First of all, increase in price of gold. Since June 2019 yellow metal is in a long term run and nearly doubled its value per ounce. Recent price developments from Q4 2023 and beyond, increased value of gold held by central banks globally significantly. On this occasion let’s not forget on Basel III - Changes initiated by above in 2019, changed systemic position of gold as an asset, elevating it in bank accounting to same level with currencies and government debt securities – assets considered in international banking as riskless.
Second, is decline of EUR/USD FX pair. Euro peaked vs USD in 2008, during financial crisis marking levels of 1.60 USD per 1 EUR. Since then it is in long-term decline, in last months of 2022 even temporarily becoming cheaper than USD. In the recent months it oscillated between 1.05-1.12 and this FX pair – at least on charts - doesn’t seem to look very good for European Central Bank. FX matters, because IMF reports above data in USD, hence weakening against USD, affects negatively value of claims in Euro.
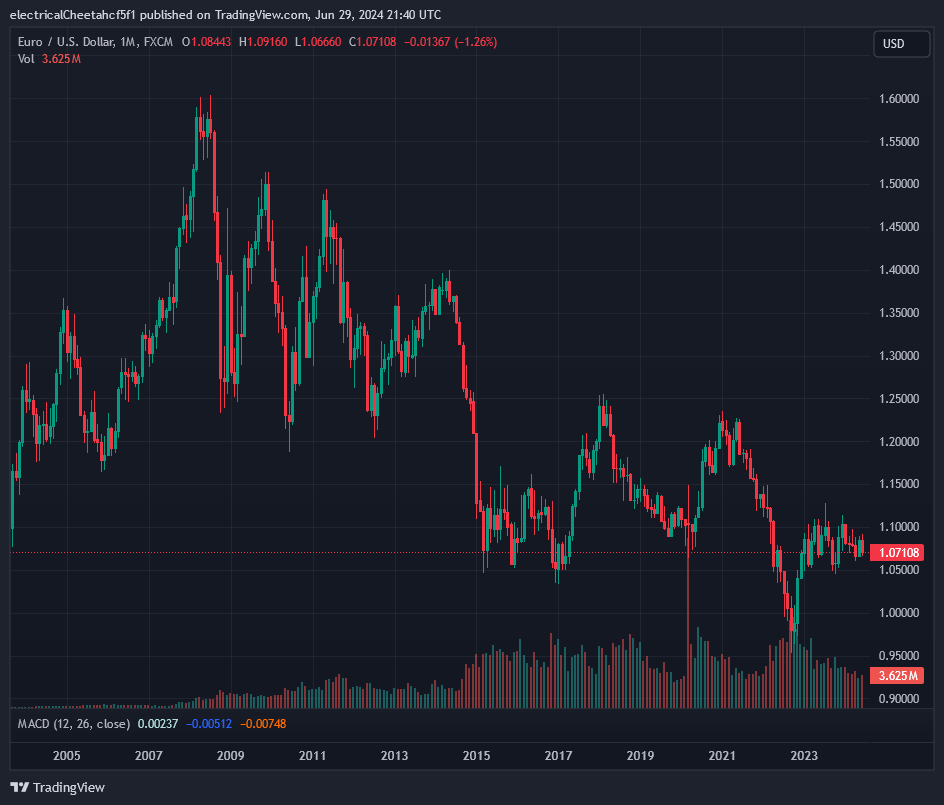
EUR/USD pair. Source: Tradingview
Another aspect is attractiveness of asset vs asset. Trend of gold purchases by central banks should be maintained, although size may not be such as in 2022 and 2023. According to IMF:
Economic fragmentation and the potential reorganization of global economic and financial activity into separate, nonoverlapping blocs could encourage some countries to use and hold other international and reserve currencies.
Hence, with array of fiscal and geopolitical issues troubling world, macro economy supports gold. On this note, Euro loses on certain attractiveness due to design flaws, but also said array of troubles affecting EU. Emergence of EUR in allocated reserves started in 2000 at 18.3%, which equalled joint share of allocated reserves in Deutsche marks, Netherland guldens and other European currencies that EUR replaced. Within couple years EUR position strengthened internationally to its peak in 2007, when it constituted for 26.1% of international allocated reserves. World loved Euro at a time, even Alan Greenspan prophesized it will replace USD as reserve currency. But then financial crisis occurred and Eurozone crisis, which had shown big cracks in the marble statue of Euro. To esteemed readers interested in this subject, we recommend our analysis ‘Gold in the BRICS Single Currency Concept p. II’, where we focused in detail on Euro and our local debt market. Since then, EUR share in international reserve assets is in decline. In 2019 EUR stood at of 20.2% and by the end of 2023, at 18.55%. And let us clearly emphasize on this occasion that, we’re well aware on significant increase of global FX assets since 2008. However since 2014 they generally tend to be on similar range 11.5-13 trl USD.
Last but not least, most important. Namely, increase in the yield on debt securities. With the increase in interest rates, there is a loss of value of previously purchased and held bonds. Nominally they are worth as price imprinted, but in the market conditions you will have to come off the price to make a sale. We wrote more on the topic in our analysis "Five percent that changed the world." And it means only one thing - a sizable portion of debt securities (here as allocated foreign exchange reserves), are not worth in the market as much as the official nominal value claim they are. And this applies to each of the countries that made rapid interest rate increase recently. This includes Eurozone securities.
Remarks on structure of central banks’ gold holdings
This makes us to ask questions on who, why, and what. Let’s take a peak on gold holdings of central banks. Advanced economies hold larger amounts of gold as a fraction of reserves than emerging markets. Estimating distribution of gold share, reveals two dominant patterns in distribution among economies. One is approximately between 0% and 10%, other between 60% and 80%.
• First, is general range of 0-10%, which due to recent pace of purchases has to be widened to 0-20%. It is being predominantly represented by emerging economies or just recently marked as developed. These would be ex-Eastern bloc democracies, un-involved bloc etc.
• Second range may be predominantly contributed to historical inheritance. Colonial France and Portugal, USA benefiting from international war transfers, Germany fearing war and hyperinflation, traditionally always gold welcoming Switzerland. One of the few exceptions is Great Britain, which sold half of its gold reserves between 1999 and 2002 during Brown’s Bottom. Other is Canada that fully sold its gold reserve in the past.
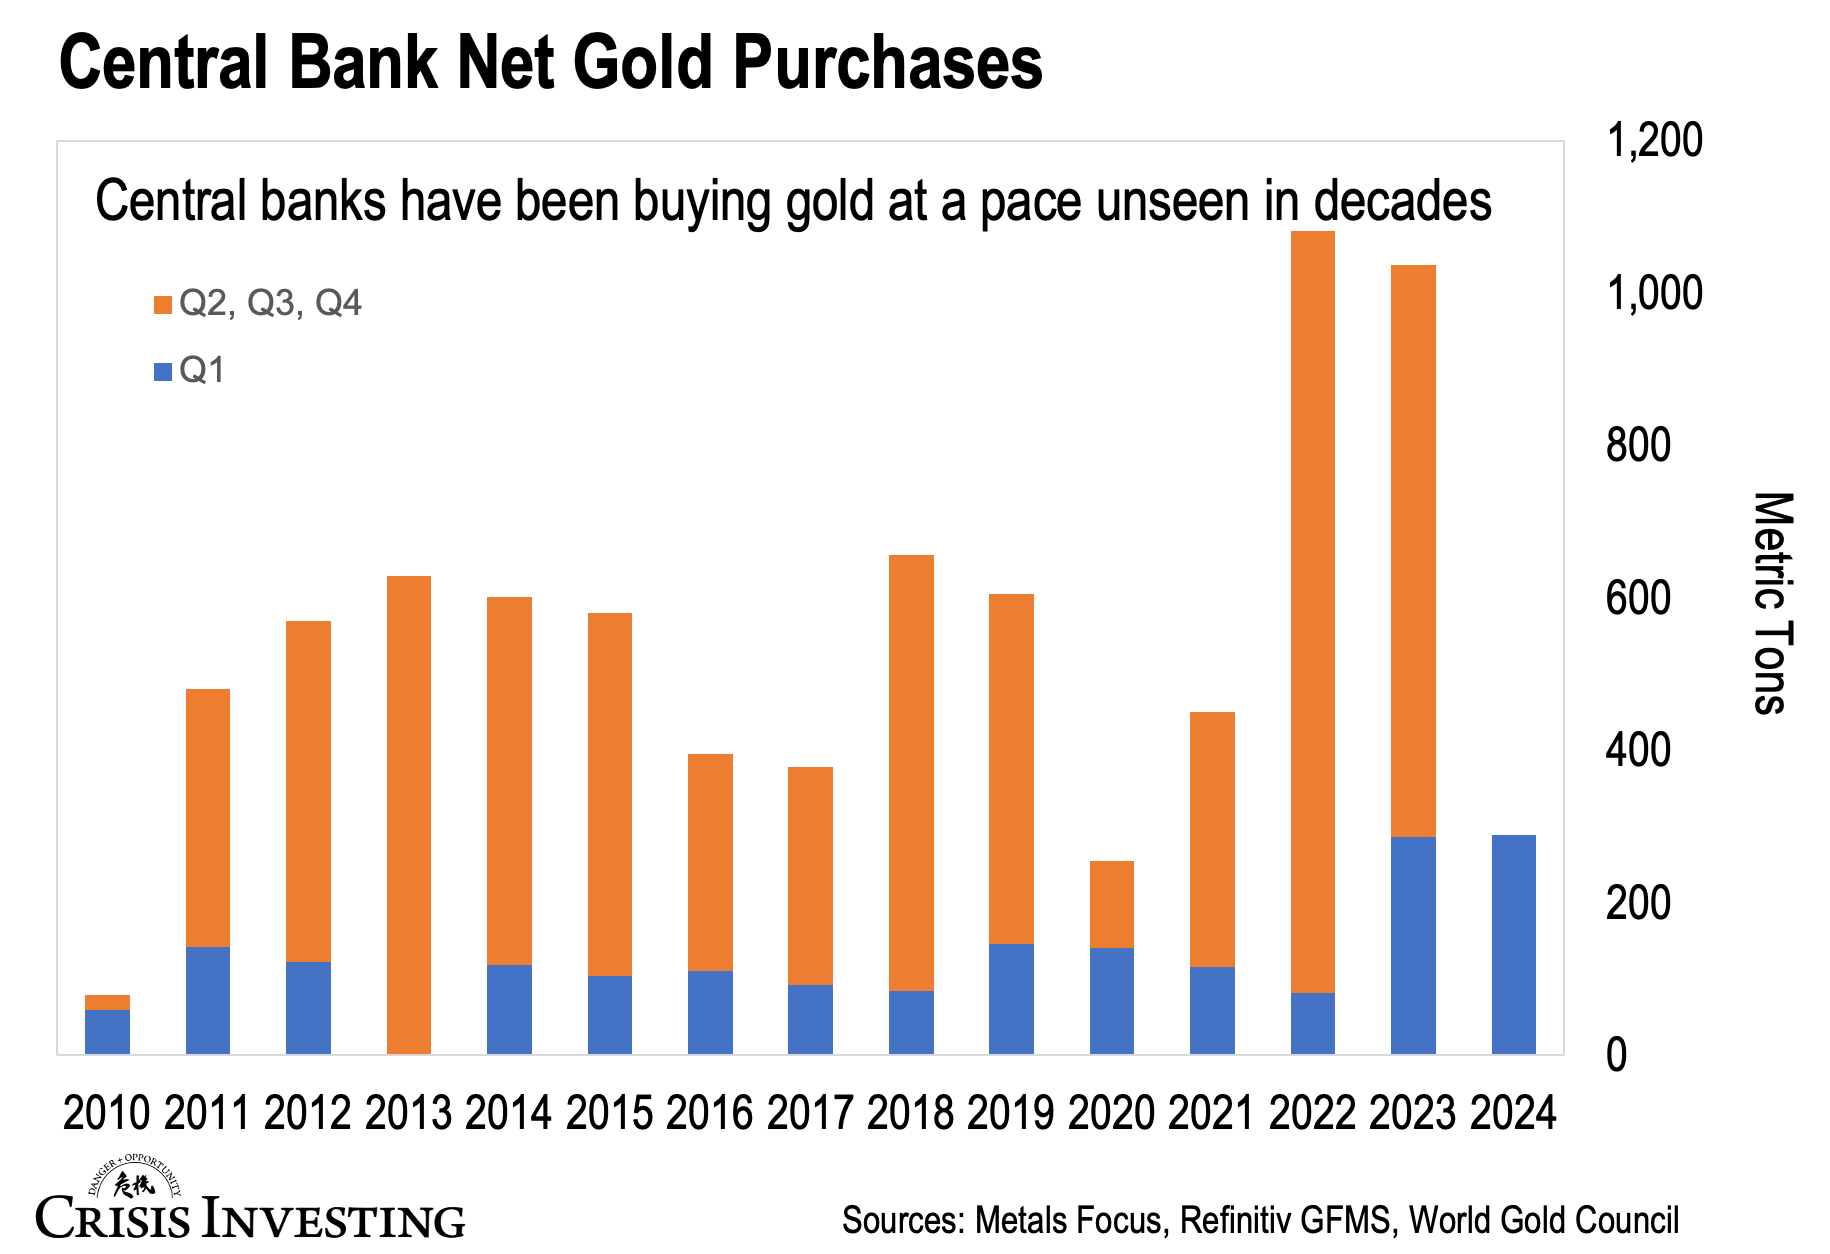
Gold purchases by central banks. Source: Metal Focus
Continued increase in size of foreign exchange reserves on emerging markets occurred after global financial crisis of 1997 and then 2007-2008. Changes in gold stocks have been accumulating gradually after the second of two financial crisis’s just mentioned, suggesting reserve management’s stick to a buy-and-hold strategy for their precious metals. Decision of central banks to choose appropriate size of gold investment is not trivial and depends on individual policies and practice goals - target duration, risk tolerance metrics, etc. Given the volatility of gold returns, owning gold as an asset - even in small amounts - seems be justifiable in most circumstances. There is strong evidence of gold's potential insurance value in adverse scenarios, which may support a higher gold allocation in cases where risk protection is to be seriously considered. Also, gold purchased come as part of a broad effort to diversify reserves away from being overly exposed on US dollar, to provide hedge against growing yield on treasury papers and as well as attempts by some nations to de-dollarize their trade relationships by conducting transactions in local currencies. After all, gold is not bound to any political force, being internationally recognisable and politically agnostic asset with limited supply.
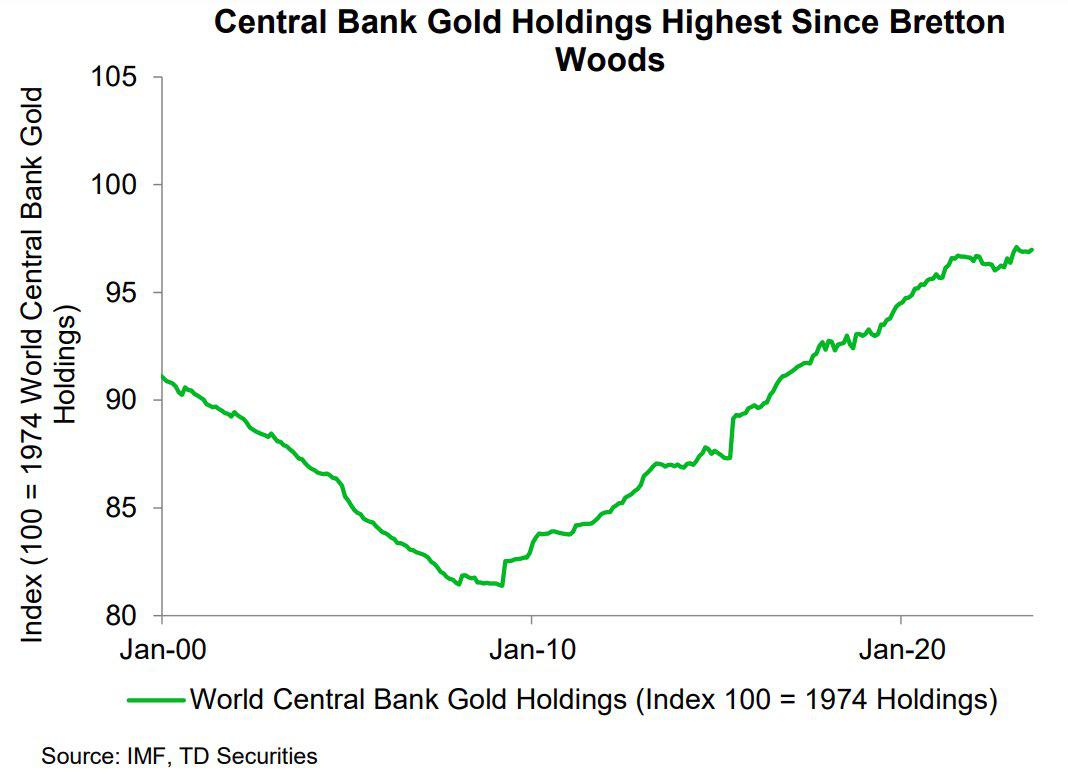
Central bank gold holdings are at highest level since 1974. Source: Gold Telegraph
But how does it looks like with regards to geographical division of official gold holdings? World Gold Council report that at the end of Q1 2024, North America (understandable here as USA, as Canada has no gold holdings) and EU members (all EU members, non-artificially divisioned as WGC did in is dataset) own approx. 3/5 of overall official global gold volumes. As mentioned before, there are approx. 36.2k t. of gold accounted towards official reserves held by central banks.
• USA itself owns 8.1k t.
• Western Europe 11.7k. As ‘Western Europe’, World Gold Council understands that as UK, Switzerland, Scandinavia, Baltic States and what traditionally is perceived as Western Europe.
• In Central and Eastern Europe (3.7k t.), WGC categorises certain EU members - Poland, Romania, Slovakia, Slovenia, Hungary, Bulgaria and Czech Republic (669 t.), as well as non-EU but geographically European nations like Serbia, and representatives of Caucasus (Armenia). However in this category, WGC also includes Russia (2.3k t.) Belarus (54 t.) and Turkey (570 t.).
• East Asia owns 3.6k t. of gold combined, however in this category we have Mainland China who reports 2.2k t. As we stated in our past analysis ‘On gold flows to China’ this volume may be questionable as it is widely expected it to be at minimum 4k t., maximum at approx. 30k t. and realistically in between 15-20k t.
• South Asia 909 t., South East Asia 800 t., Central Asia 723 t., Middle East and North Africa nearly 1.6k t.
• Sub-Saharan Africa 172 t., Australia and Oceania combined approx. 80 t. Latin America (South and Central) is getting closer to 700 t. altogether.
Upon attempt to redraw above picture to present more realistic geographic and geopolitical division, we could see how official gold ownership has changed in the last years. This is result of years-long trend of purchases performed by emerging markets of i.e. Asia, Central Europe and South America. Based on WGC methodology, just Asian central banks added to its gold holding approx. over 6.k t. net, out of total 6.2k t. purchased globally by central banks since 2008. In recent years, even some Asian countries that didn’t buy gold since years also been activated – Qatar, UAE, Singapore. Even Japan – traditionally bound with USD – made purchase of 80 t. in 2021.There are also unconfirmed yet officially reports, that Saudi Arabia has joined the pack.
This shopping spree has been led by Russia that in a period discussed purchased nearly 1.9k t., China with official purchases at over 1.6k t., India at 469 t. and Turkey with 462 t. Only then, first representative of global ‘West’ appears – Poland with 260 t. purchased since 2008. Of course for every major buyer, pace differs, final destination differs, reasons behind shopping may be different, same with sourcing (as gold may be purchased on OTC markets or from domestic producers) etc. All to be considered individually.
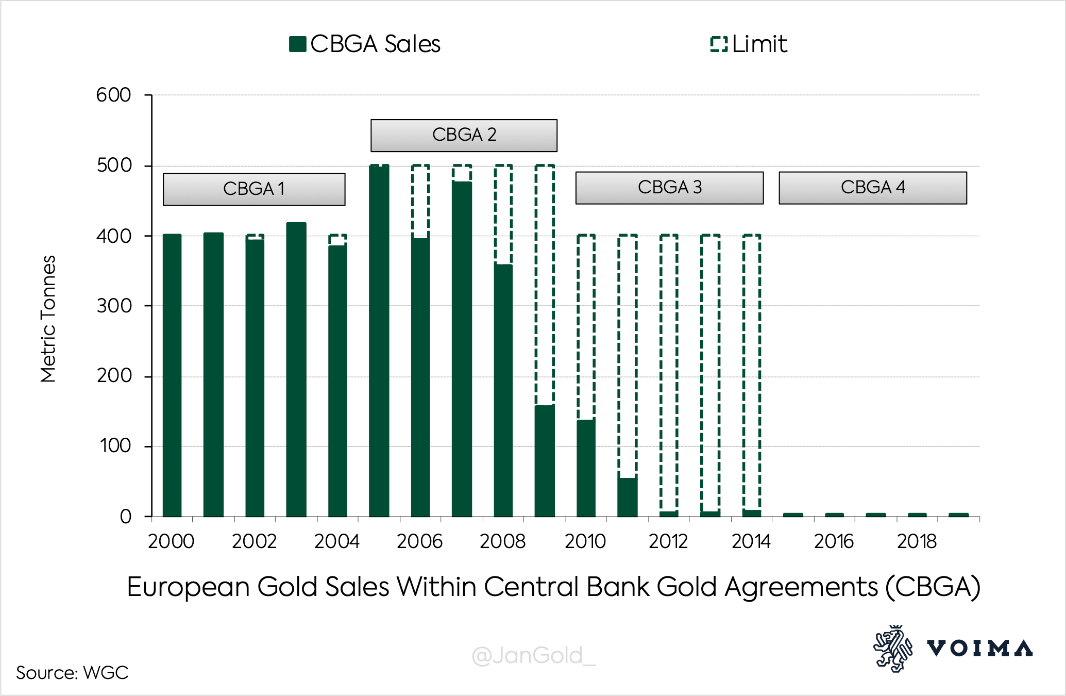
CBGA sales of gold by central banks of Europe. Source: WGC
Among notable gold sellers were Euro area, and individually among them Portugal, Netherlands and France. Euro Area & others signatories’ of non-existing anymore CBGA, limited its gold sales as a result of last financial crisis. But prior to 2009 it was Eurozone to be major provider of gold to the interested counterparties. Just in 2005 it disposed record 439 t. As part of it, Paris ceased its significant (even triple digit per annum) disposals at 2009. Similarly Netherlands and Portugal, while Germany continues selling small volumes - since 2008 at 3.7 t. per annum.
But it’s not that global ‘West’ ignored gold or lost its path.. Its central banks still own majority of global central banks’ gold, two main precious metals trading markets are located in New York and London. It also issues vast majority of most important trading currencies in the word (USD, EUR, JPY, GBP, CHF, AUD, CAD). Among them possible weapon of mass destruction - US dollar.
Summary
We’re experiencing decade of geopolitical tensions, inflationary and deflationary pressures, primacy of fiscal politics over common sense and great changes that may occur or at least are attempted. Just to mention on Saudi Arabia not exceeding petrodollar agreement and leaning towards central bank digital currency project led by Bank of International Settlements and China. However, this period only seems to be a development of what has happened in the past.
In 1997, Asian financial crisis caused immense need for liquidity, hence Asia started its mass asset purchasing programme. Speed and fast pace of such changes, made transitional category of ‘unallocated’ reserve assets to swell to the point of exceeding USD allocations in Q1 2008. However in unallocated could be anything, including said USD, but also later on EUR.
World seemed to love EUR, at least until when Global Financial Crisis of 2007-2008 and then Eurocrisis of 2011-2013 showed flaws of common currency and released some inner daemons within EU. After all lack of common debt market was greatly supportive for main beneficiaries of Euro project, but in times of serious troubles such approach deeply fragmented Euro bond market competitiveness. Period before these marked peak performance for Euro. After which, we experienced long-term decline of EUR in the form we know.
This is when part of the world discouraged by USA’s inability to contain crisis which did spread globally – started to perceive issues in using trade currencies, they had no control upon. Some were traditional goldbugs since hundreds if not thousands years. Some were BRICS founding nations, some were US political enemies - new and old foes. Some were simply disappointed counterparties, while some simply opted for non-bias technocratic approach. But they all had one in common – started to purchase gold, and since 2010 continue to do so.
And so, fact that gold surpassed EUR among allocated reserves is attributable to long-term development. And although it has to be perceived as preparing countermeasures against issues troubling world of economy and money from a certain point of view it is statistically satisfying and pleasant event.