
Merry Crisis and a Happy New Fear - 2024 outlook, part 2


New Year – new opportunities, expectations and challenges. Considering its 2019 which could be percieved as last rather normal year, we’d expect economic, financial, political and geopolitical roller-coaster to continue. And this will continue to impact our lives and investments. However, world didn’t end since and it doesn’t seem to it in the nearest future, and so we must carry on thinking forward. So, what to expect from precious metals in 2024?metalach szlachetnych w 2024 roku?.

"Merry Crisis and a Happy New Fear". Slogan that appeared as graffiti in Athens during December 2008 protests in Greece. Source: https://streetartutopia.com/2021/12/23/merry-crisis-and-happy-new-fear/
We continue our 2024 market outlook. Of course, our main interest would be precious metals, however our approach is to present certain logic, chain of events, and how certain macro factors may affect each other in direct or indirect way. In part one, we had covered such subject of interest cuts, treasuries, stocks, US dollar and unemployment. Let’s continue then…
Although we apply our analytical macro skills, at the end of a day we’re unable to perfectly predict future. Hence please bear in mind, below content is no financial advice whatsoever but simply an opinion, which may or may not take certain risk factors under consideration.
Consumer spending
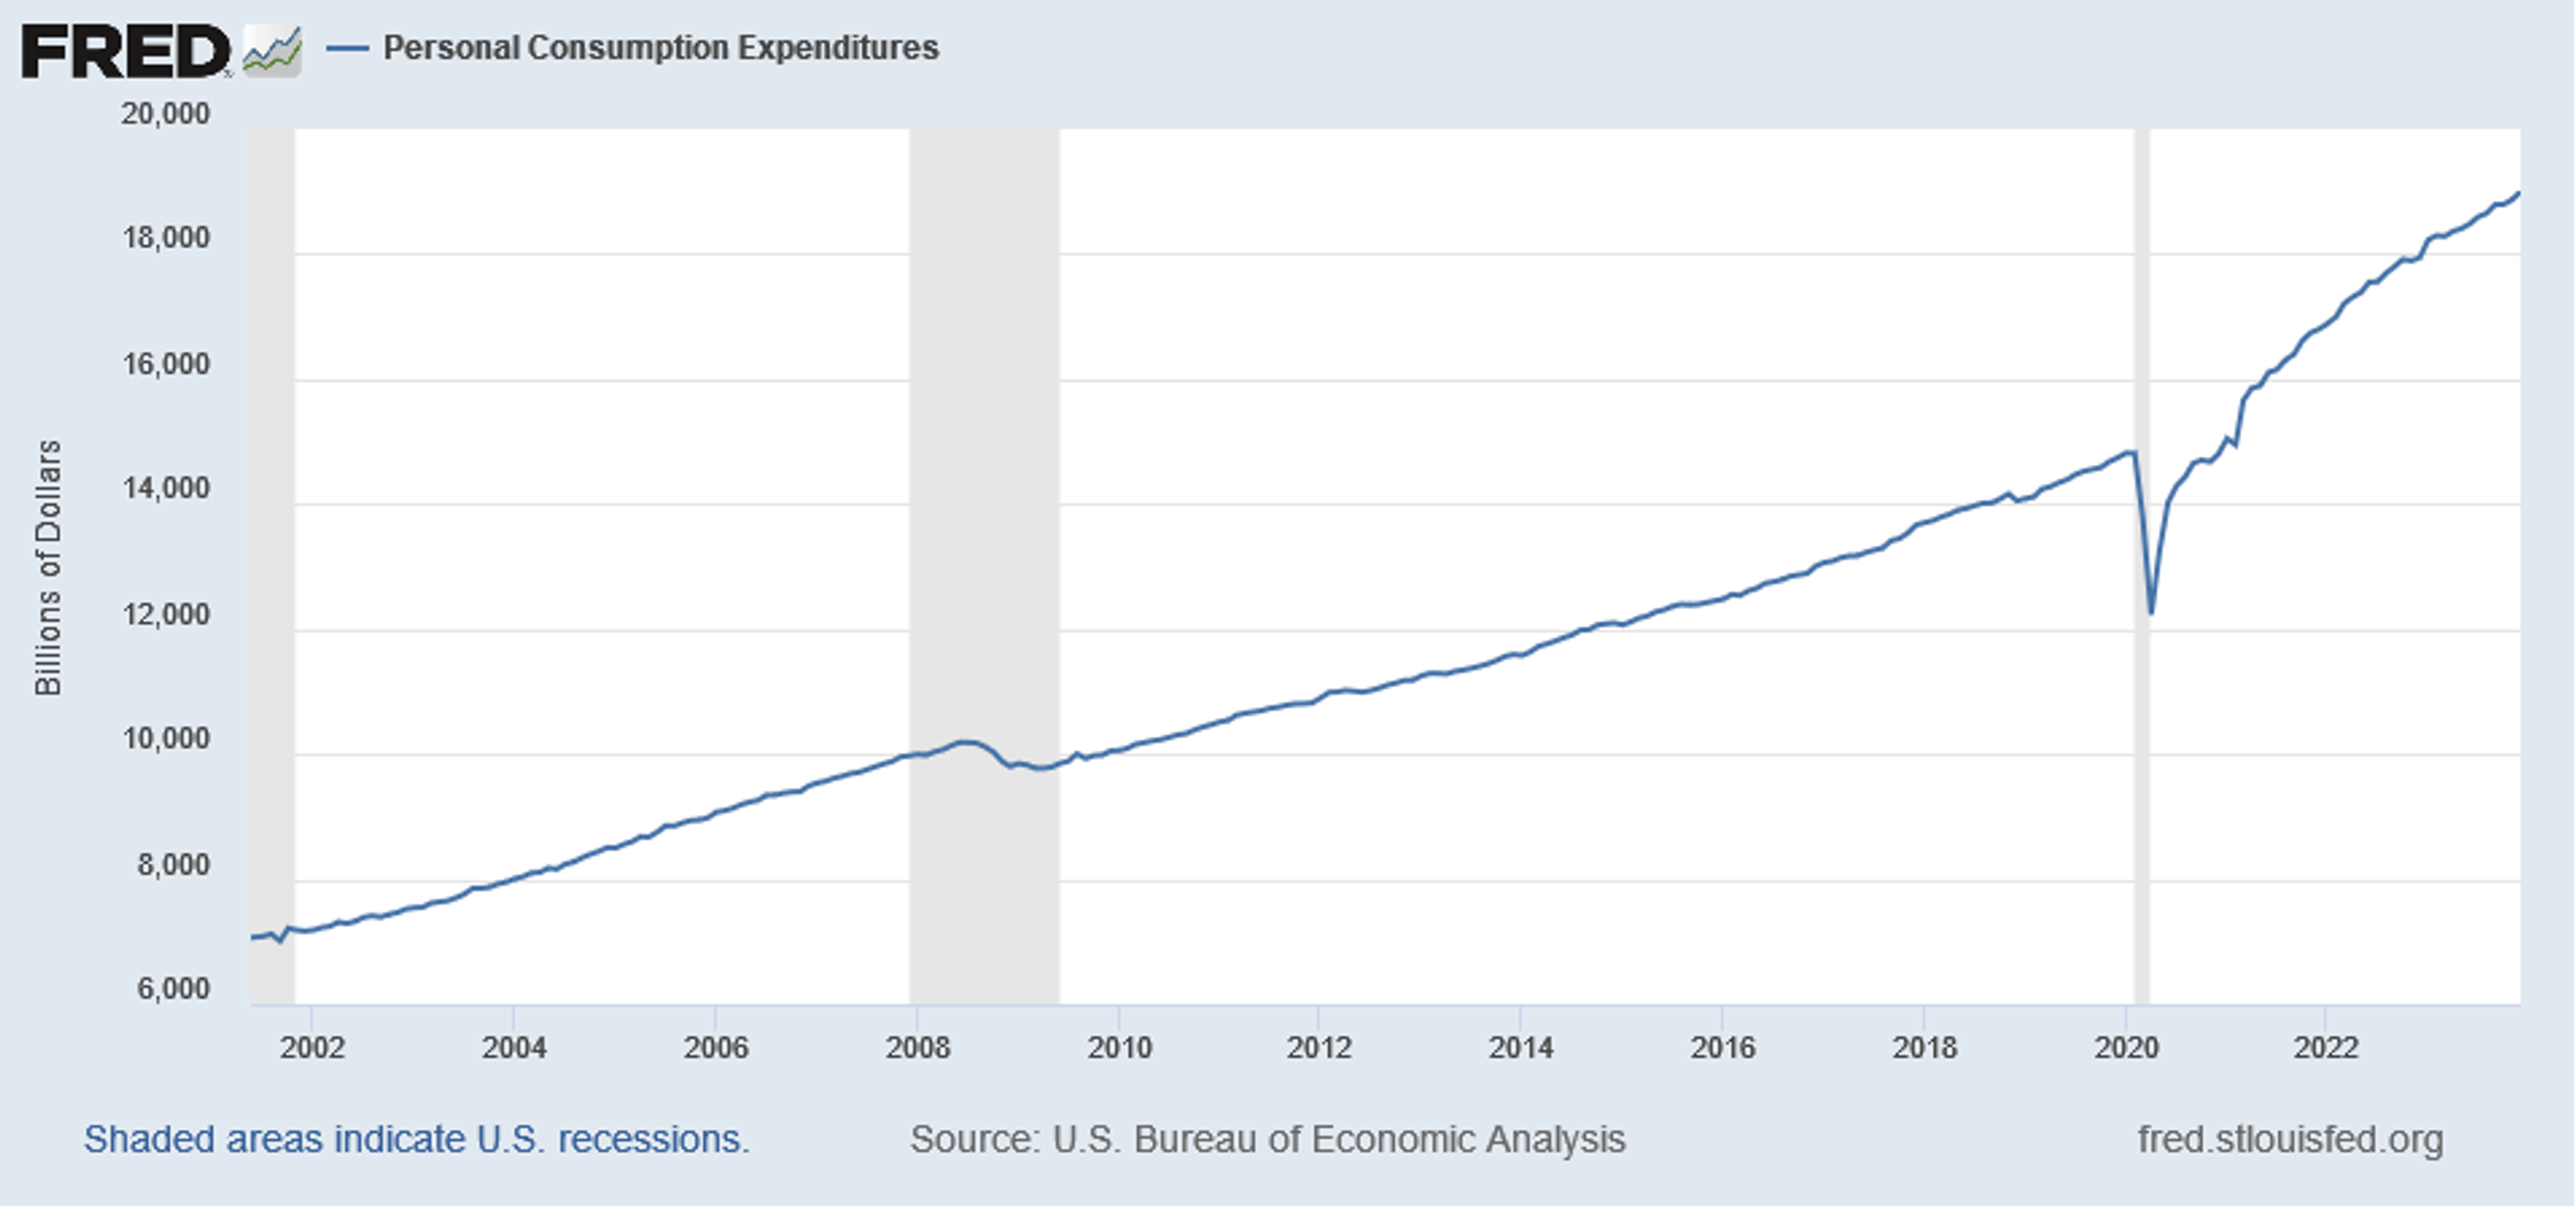
Personal Consumption Expenditures (PCE) in USA. Source: https://fred.stlouisfed.org
FED aims to minimising inflation without chocking economic activity to death. What directly relates to this, is personal consumption expenditure. Just this group accounts for 2/3rd of US economy and it continues to rise. However underneath optimistic charts there is also a question about influence of inflation, change of spending habits, cost of living crisis and remaining excess savings.
2020 Covid pandemic triggered some actions and responses by central banks and governments. For a couple months world stood still. To support restart, some heavy liquidity injections had been made to the system. Among them were infamous helicopter money, which at a time did build some significant excess savings.
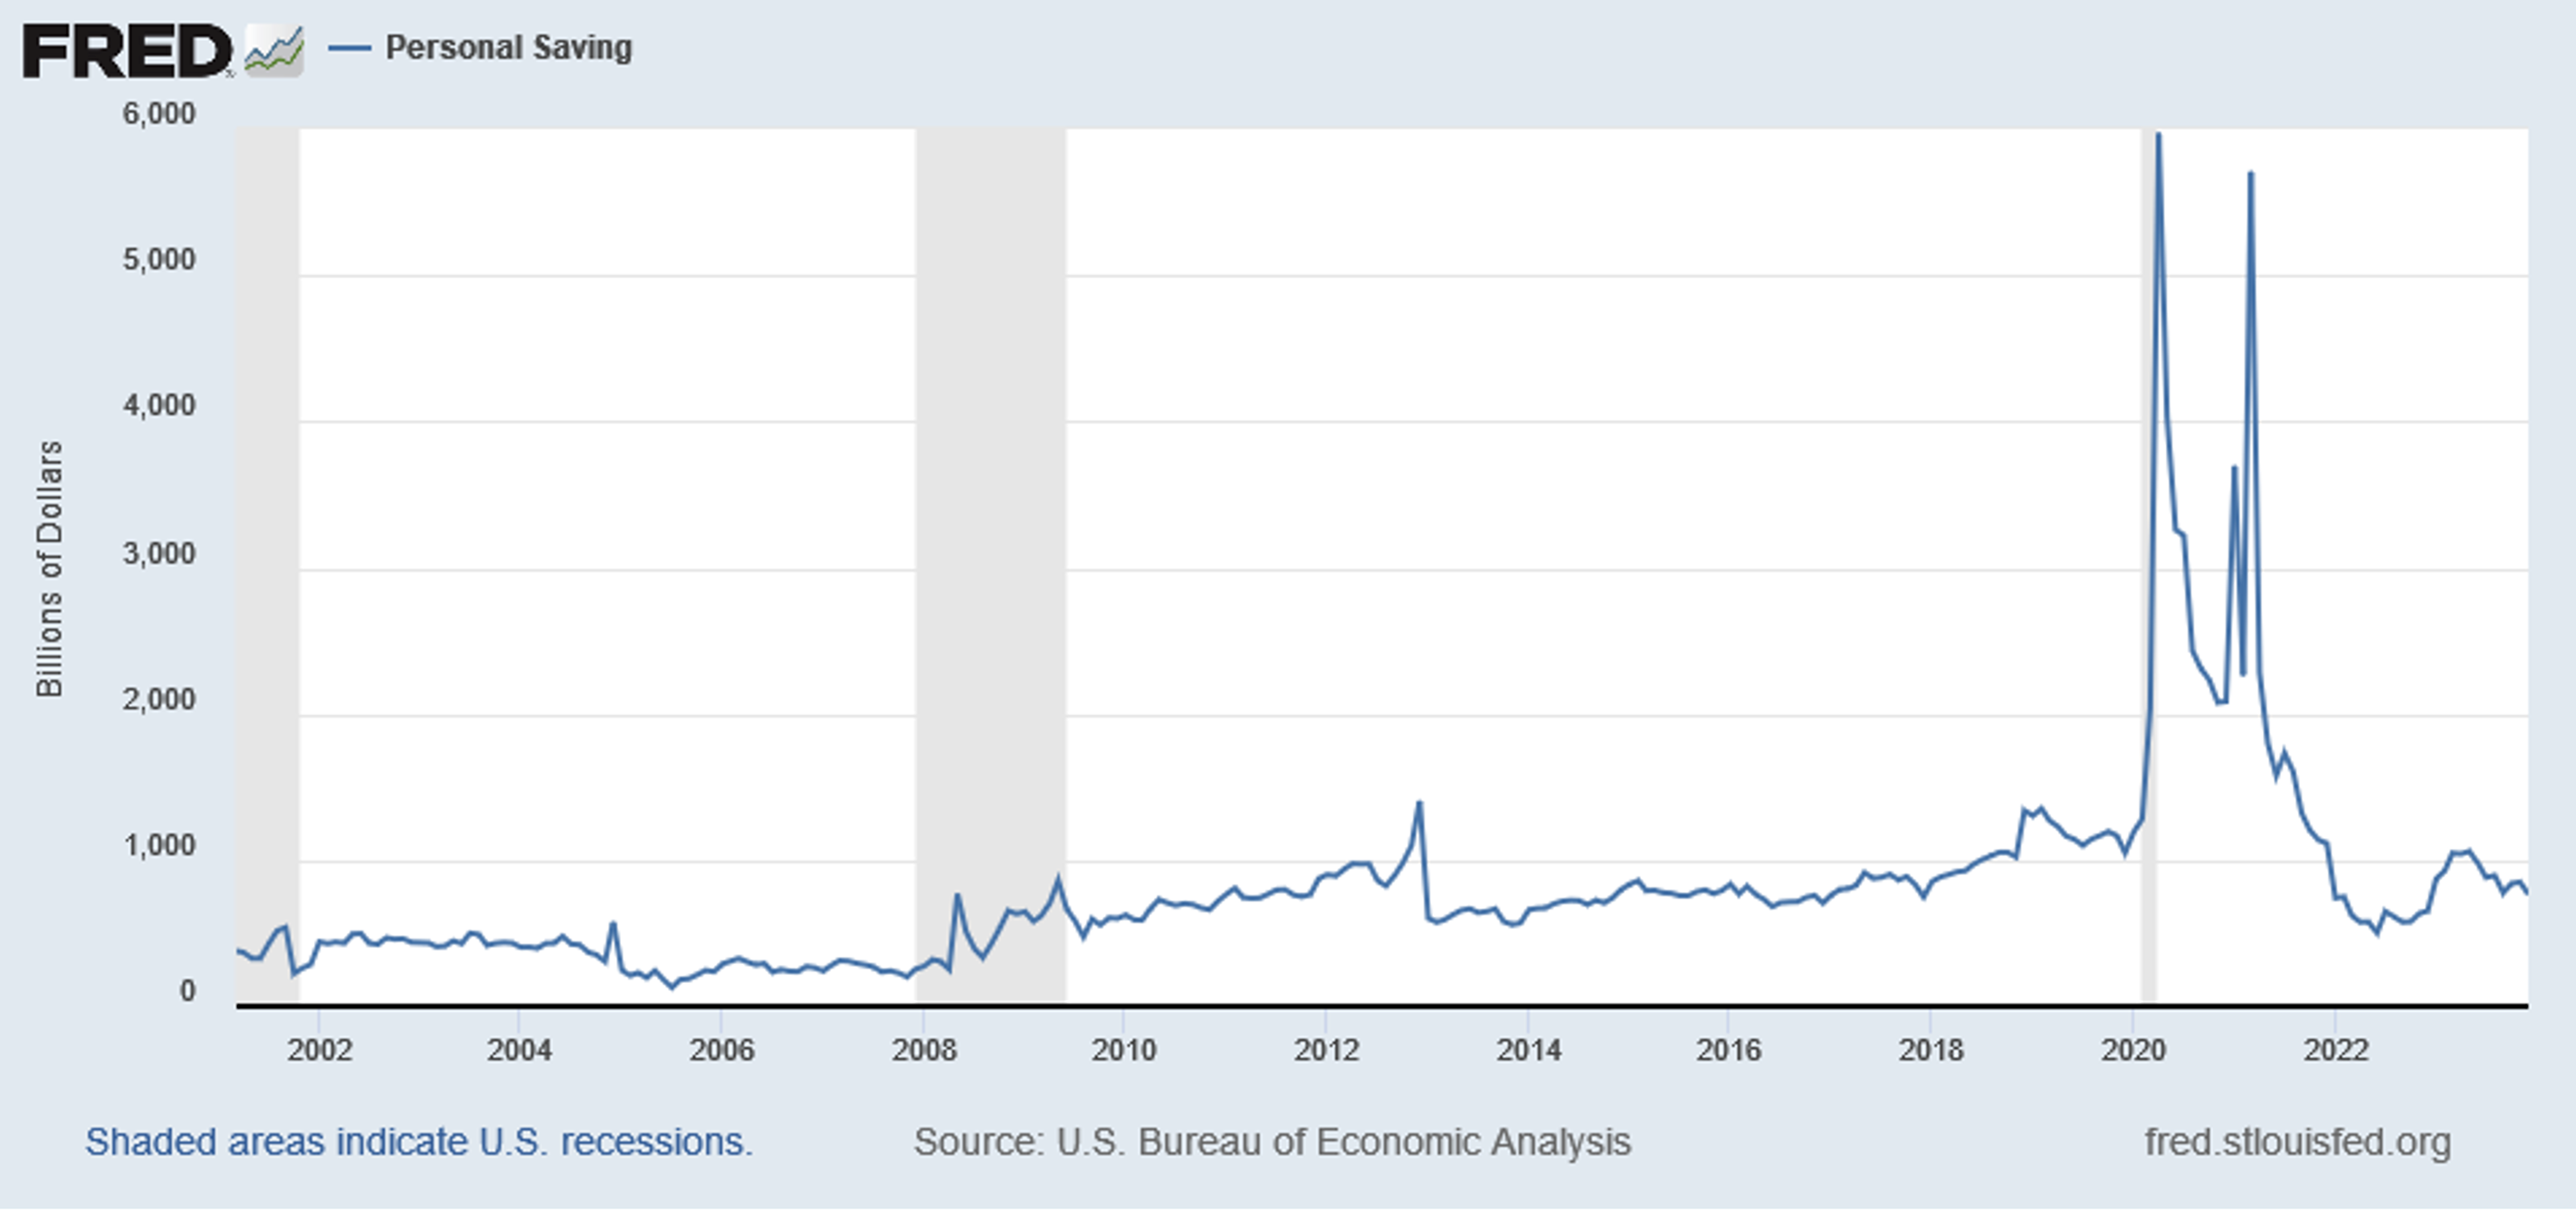
Personal Savings. Source: https://fred.stlouisfed.org
This excess pool had diminished from 8% pre-pandemic level to 3.3% now, being spent on products and services. Despite of decline we seem to observe ample capacity for future consumer spending in terms of personal saving, with levels stabilised at around pre-pandemic levels. But consumers are being affected by inflationary prices, which are especially visible on energy, food and certain other products. That is ‘cost of living’ crisis which especially affects lower and middle class. Often associated in mass-media with Russia’s made energy crisis, while they tend to forget about decade of quantitative easing finalised by crown jewel in form of Covid-QE liquidity injections.
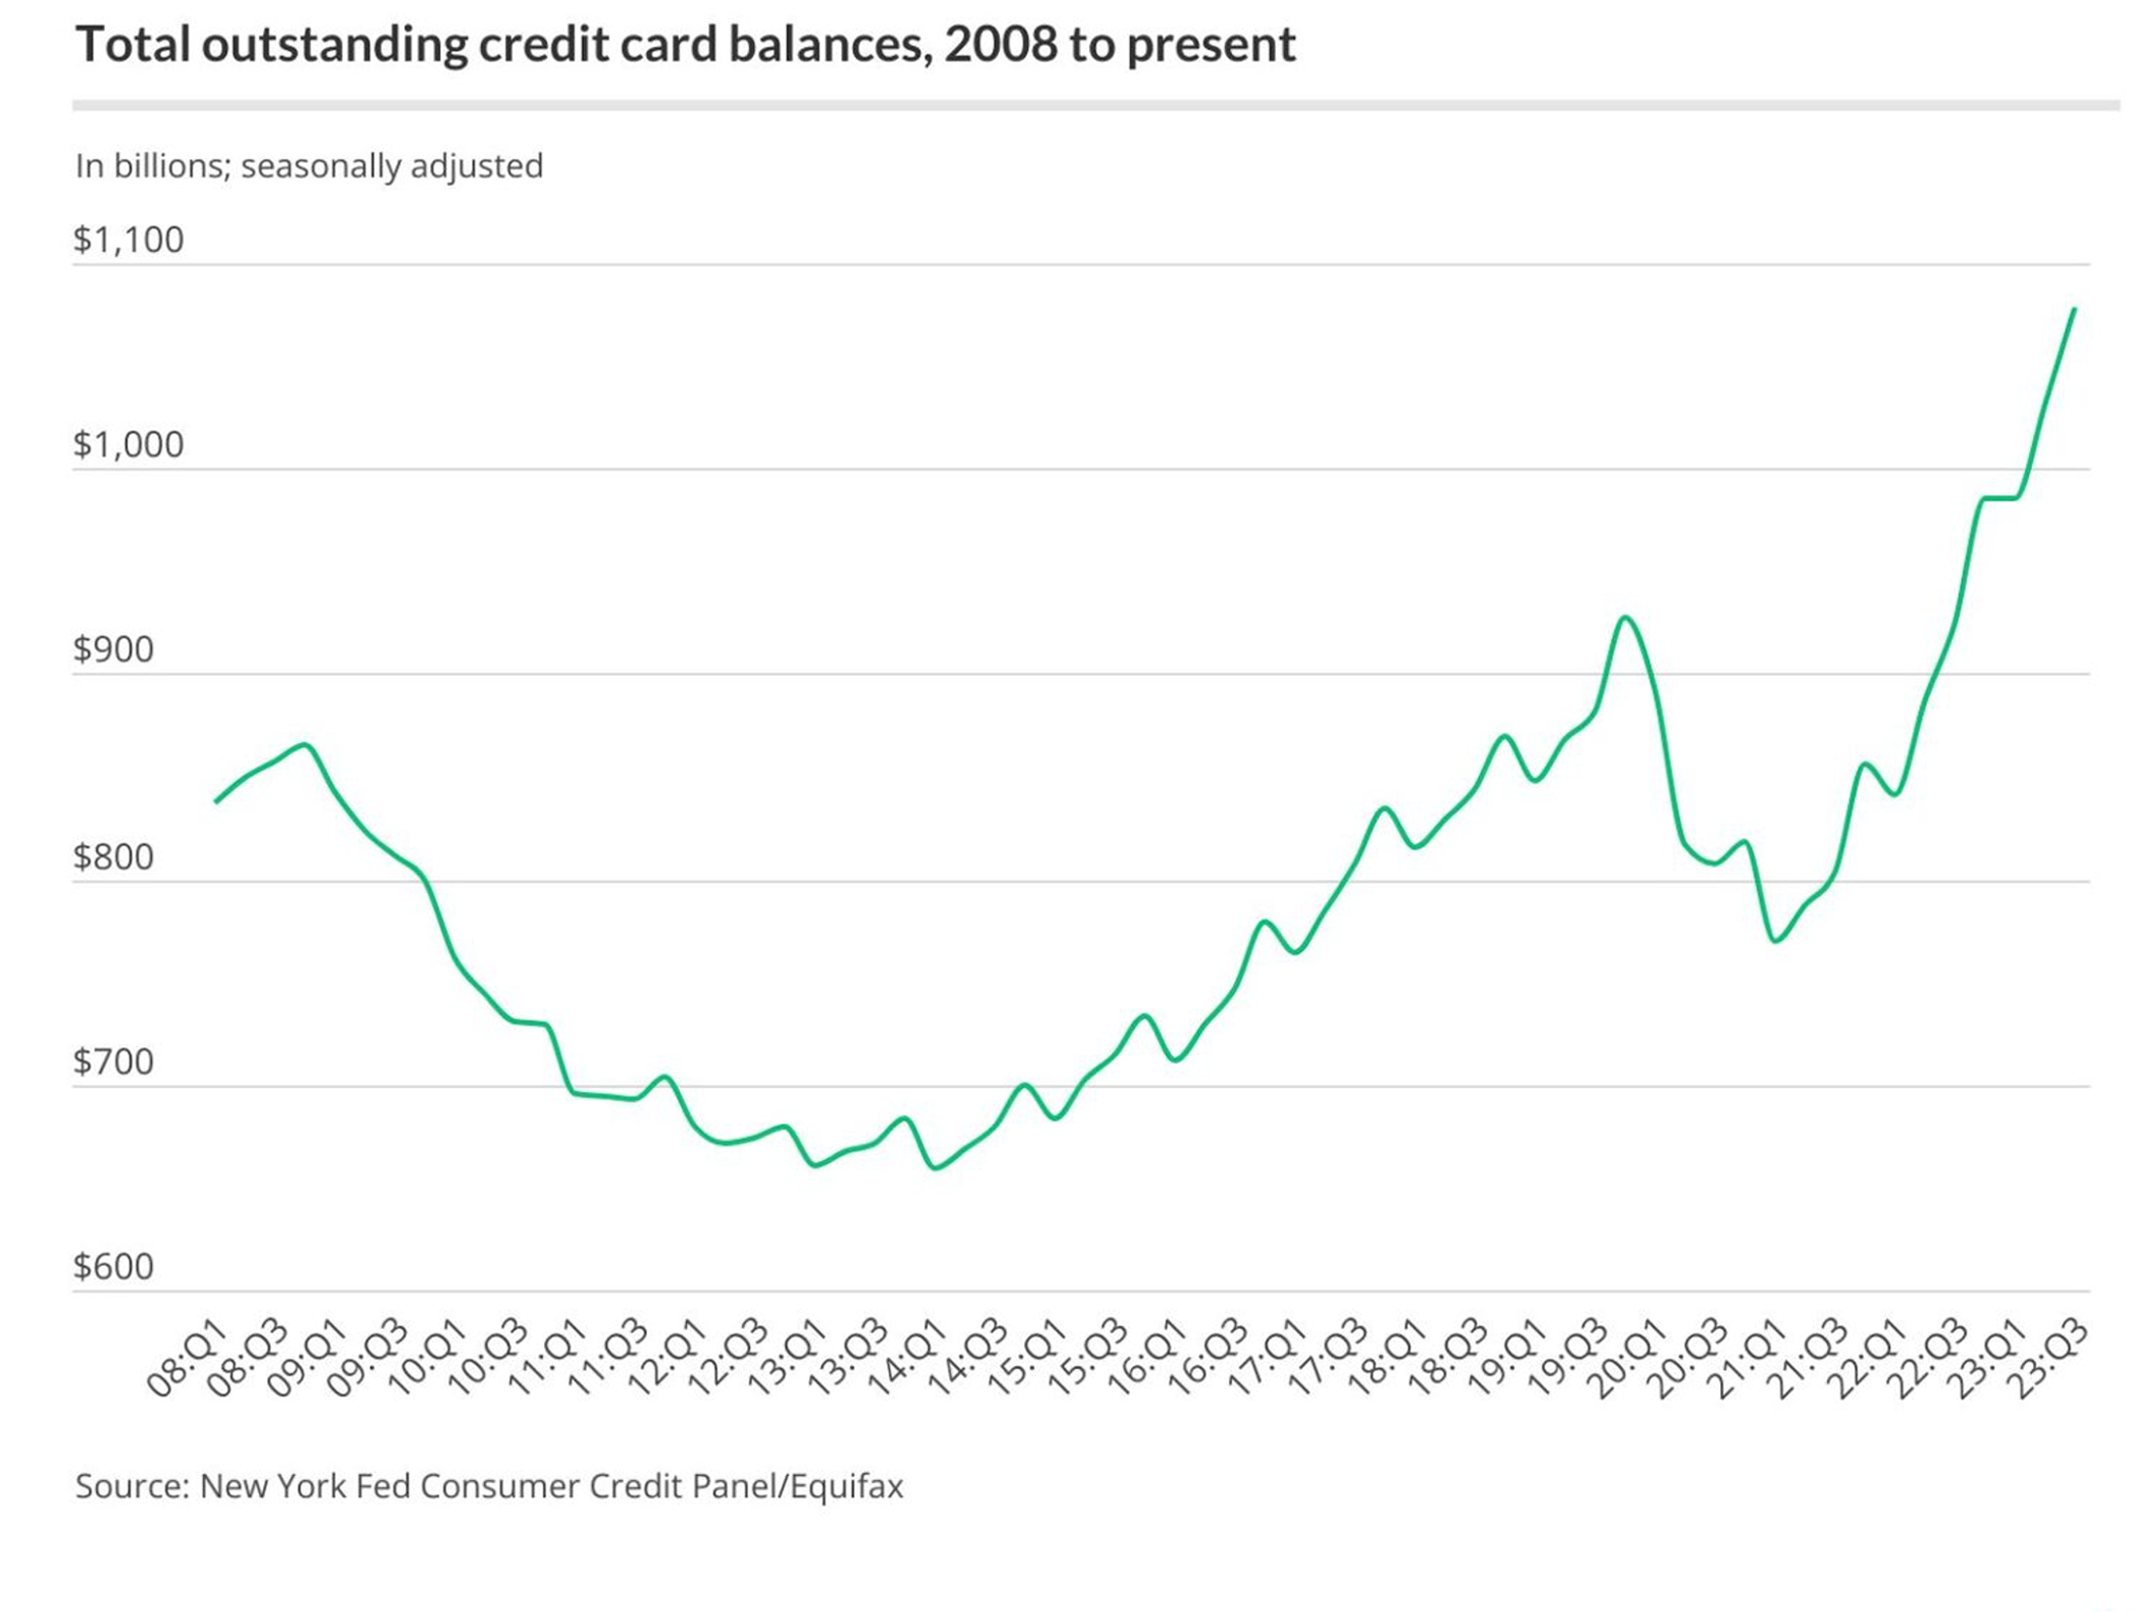
Total outstanding credit card balances. Source: https://www.lendingtree.com/credit-cards/credit-card-debt-statistics/
Above chart shows total outstanding credit card balances which are back to a trend-line broken by pandemic. It is booming and may indicate combination of two opposite items – consumer must save its budget by extensive credit card usage, but other consumer habitually uses its credit card instead of savings. Chart itself doesn’t indicate any of these prevailing, so need to dig deeper. According to very recent – published in January 2024 – studies by Bankrate:
- 36% of Americans say they have more credit card debt than emergency savings (if any)
- Rising interest rates affected inflation levels, changed interests on saving accounts but at the same time made credit costs more expensive to handle.
- US adults point to inflation as the main reason why they are unable to save for the unexpected.
- 45% of queried Americans say rising interest rates are behind their lower savings account contributions.
- 21% of Americans indicated that they’d resort to using their credit cards in case of emergency.
- 2% indicated lack of any savings.
Someone could comment on this occasion – citizens of developed nations are always heavily indebted and similar statistical numbers were visible before 2019. We couldn’t agree more – it’s just market and economic environment deteriorated since. Especially this last bullet point is considered concerning with regards to personal debt burdens and should sour below chart on available disposable personal income.

US Real Disposable income suggest consumer spending capacity. Source: https://fred.stlouisfed.org
We could see, that interest hike contributed to percentage of credit card balances 30+ days overdue. Some consumers using their credit cards has either troubles to pay them or stuck and succumbs in debt spiral.
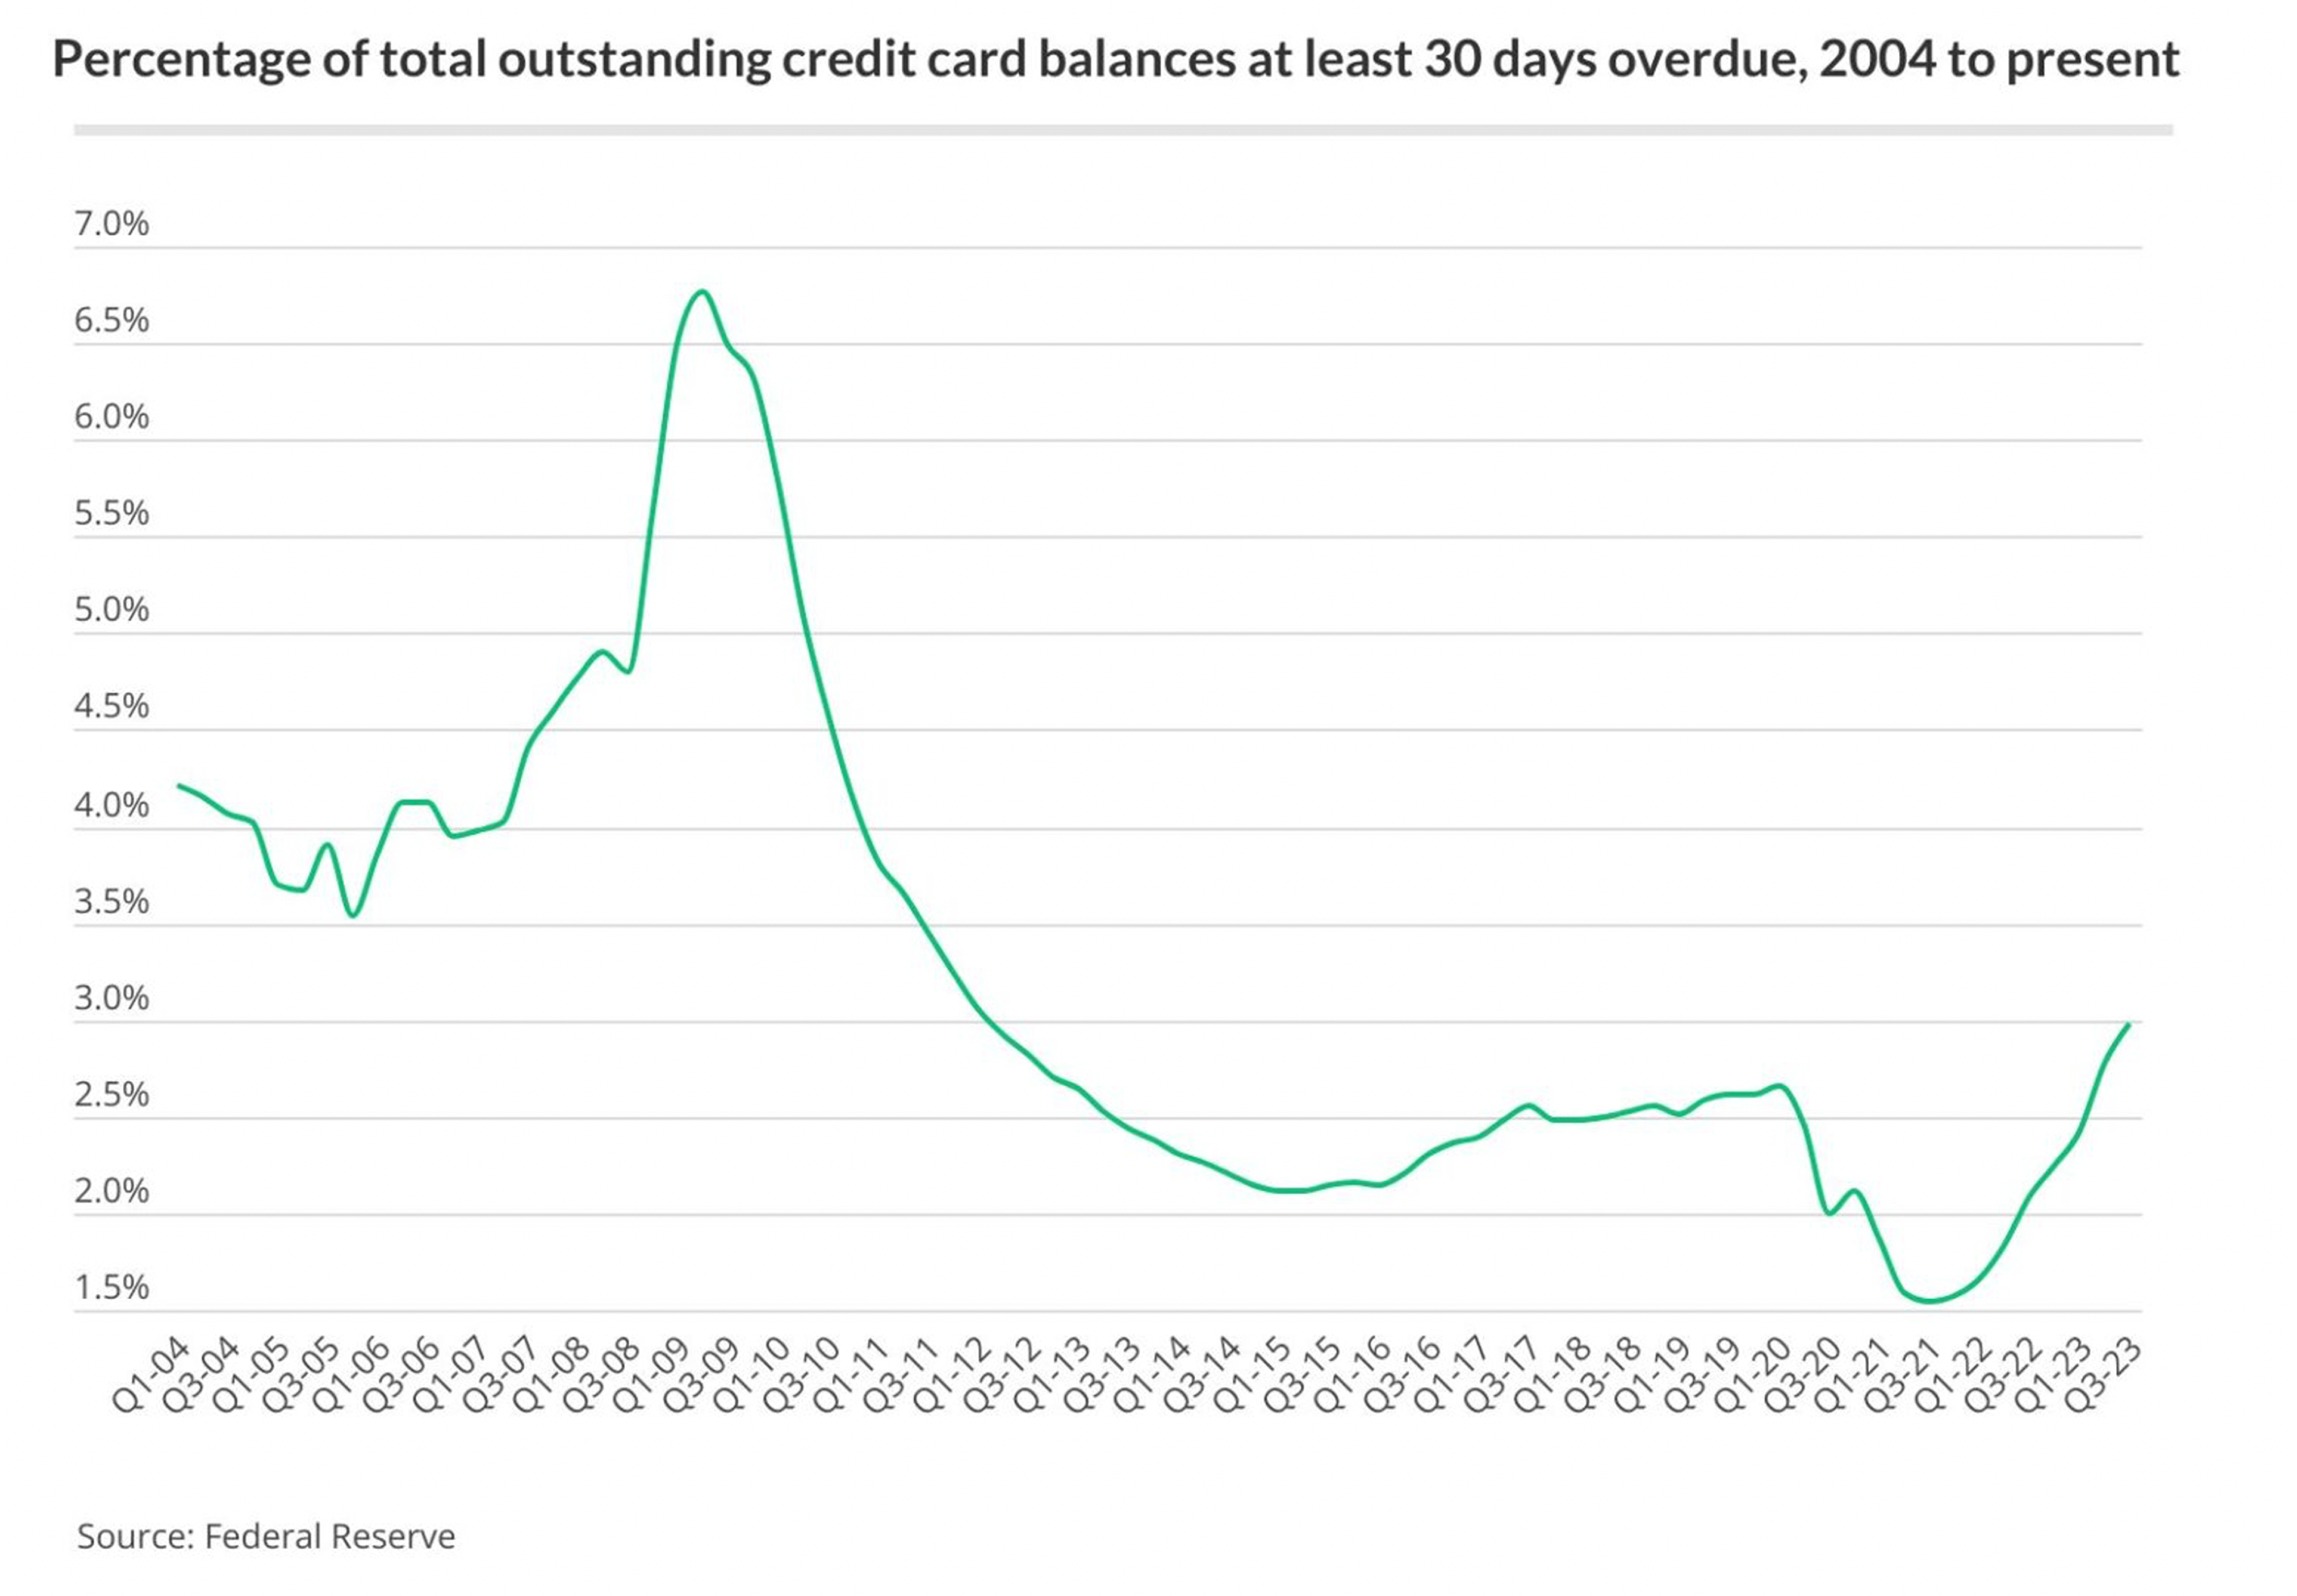
Credit card debt over 30 days overdue seems to be growing. Source: LendingTree
Overall, there’s mixed view, where charts seem not to be bad – especially if considered how developed nations overuse their credit cards. but upon visit in local store, consumer pays with credit card for goods subjected to shrinkflation. Consumer try to spend less, avoiding ‘luxury goods’ – new car, refurbishing, bigger tv etc. This affects production related indicators and in delayed way also service sectors. We also observe boom on ‘buy now pay later’ scheme, which simply are loans, overdrafts and credit cards of any sort. Fact is, that scale of phenomenon is growing and lowered demand for goods and services should attribute to growth on unemployment, which is considered as lagging indicator. This is for now supressed by creation of government jobs.Overall however, US statistics on consumer spending tend to look… ‘not bad’, especially if compared to proportionate numbers related to UK, Germany or other developed economies.
Inflation, de-inflation and other ‘tions’
US CPI expectations are that FED won’t hit its long time ago assumed 2% target. CPI is expected to fall in 2024 to 2.6% and to further drop in 2025 to 2.3%. Of course, these figures are based on certain data driven model, which doesn’t take under consideration any unexpected or newly developed issues which could have long-term effects. As for end of December 2023 official headline and core inflation in US remains as below:
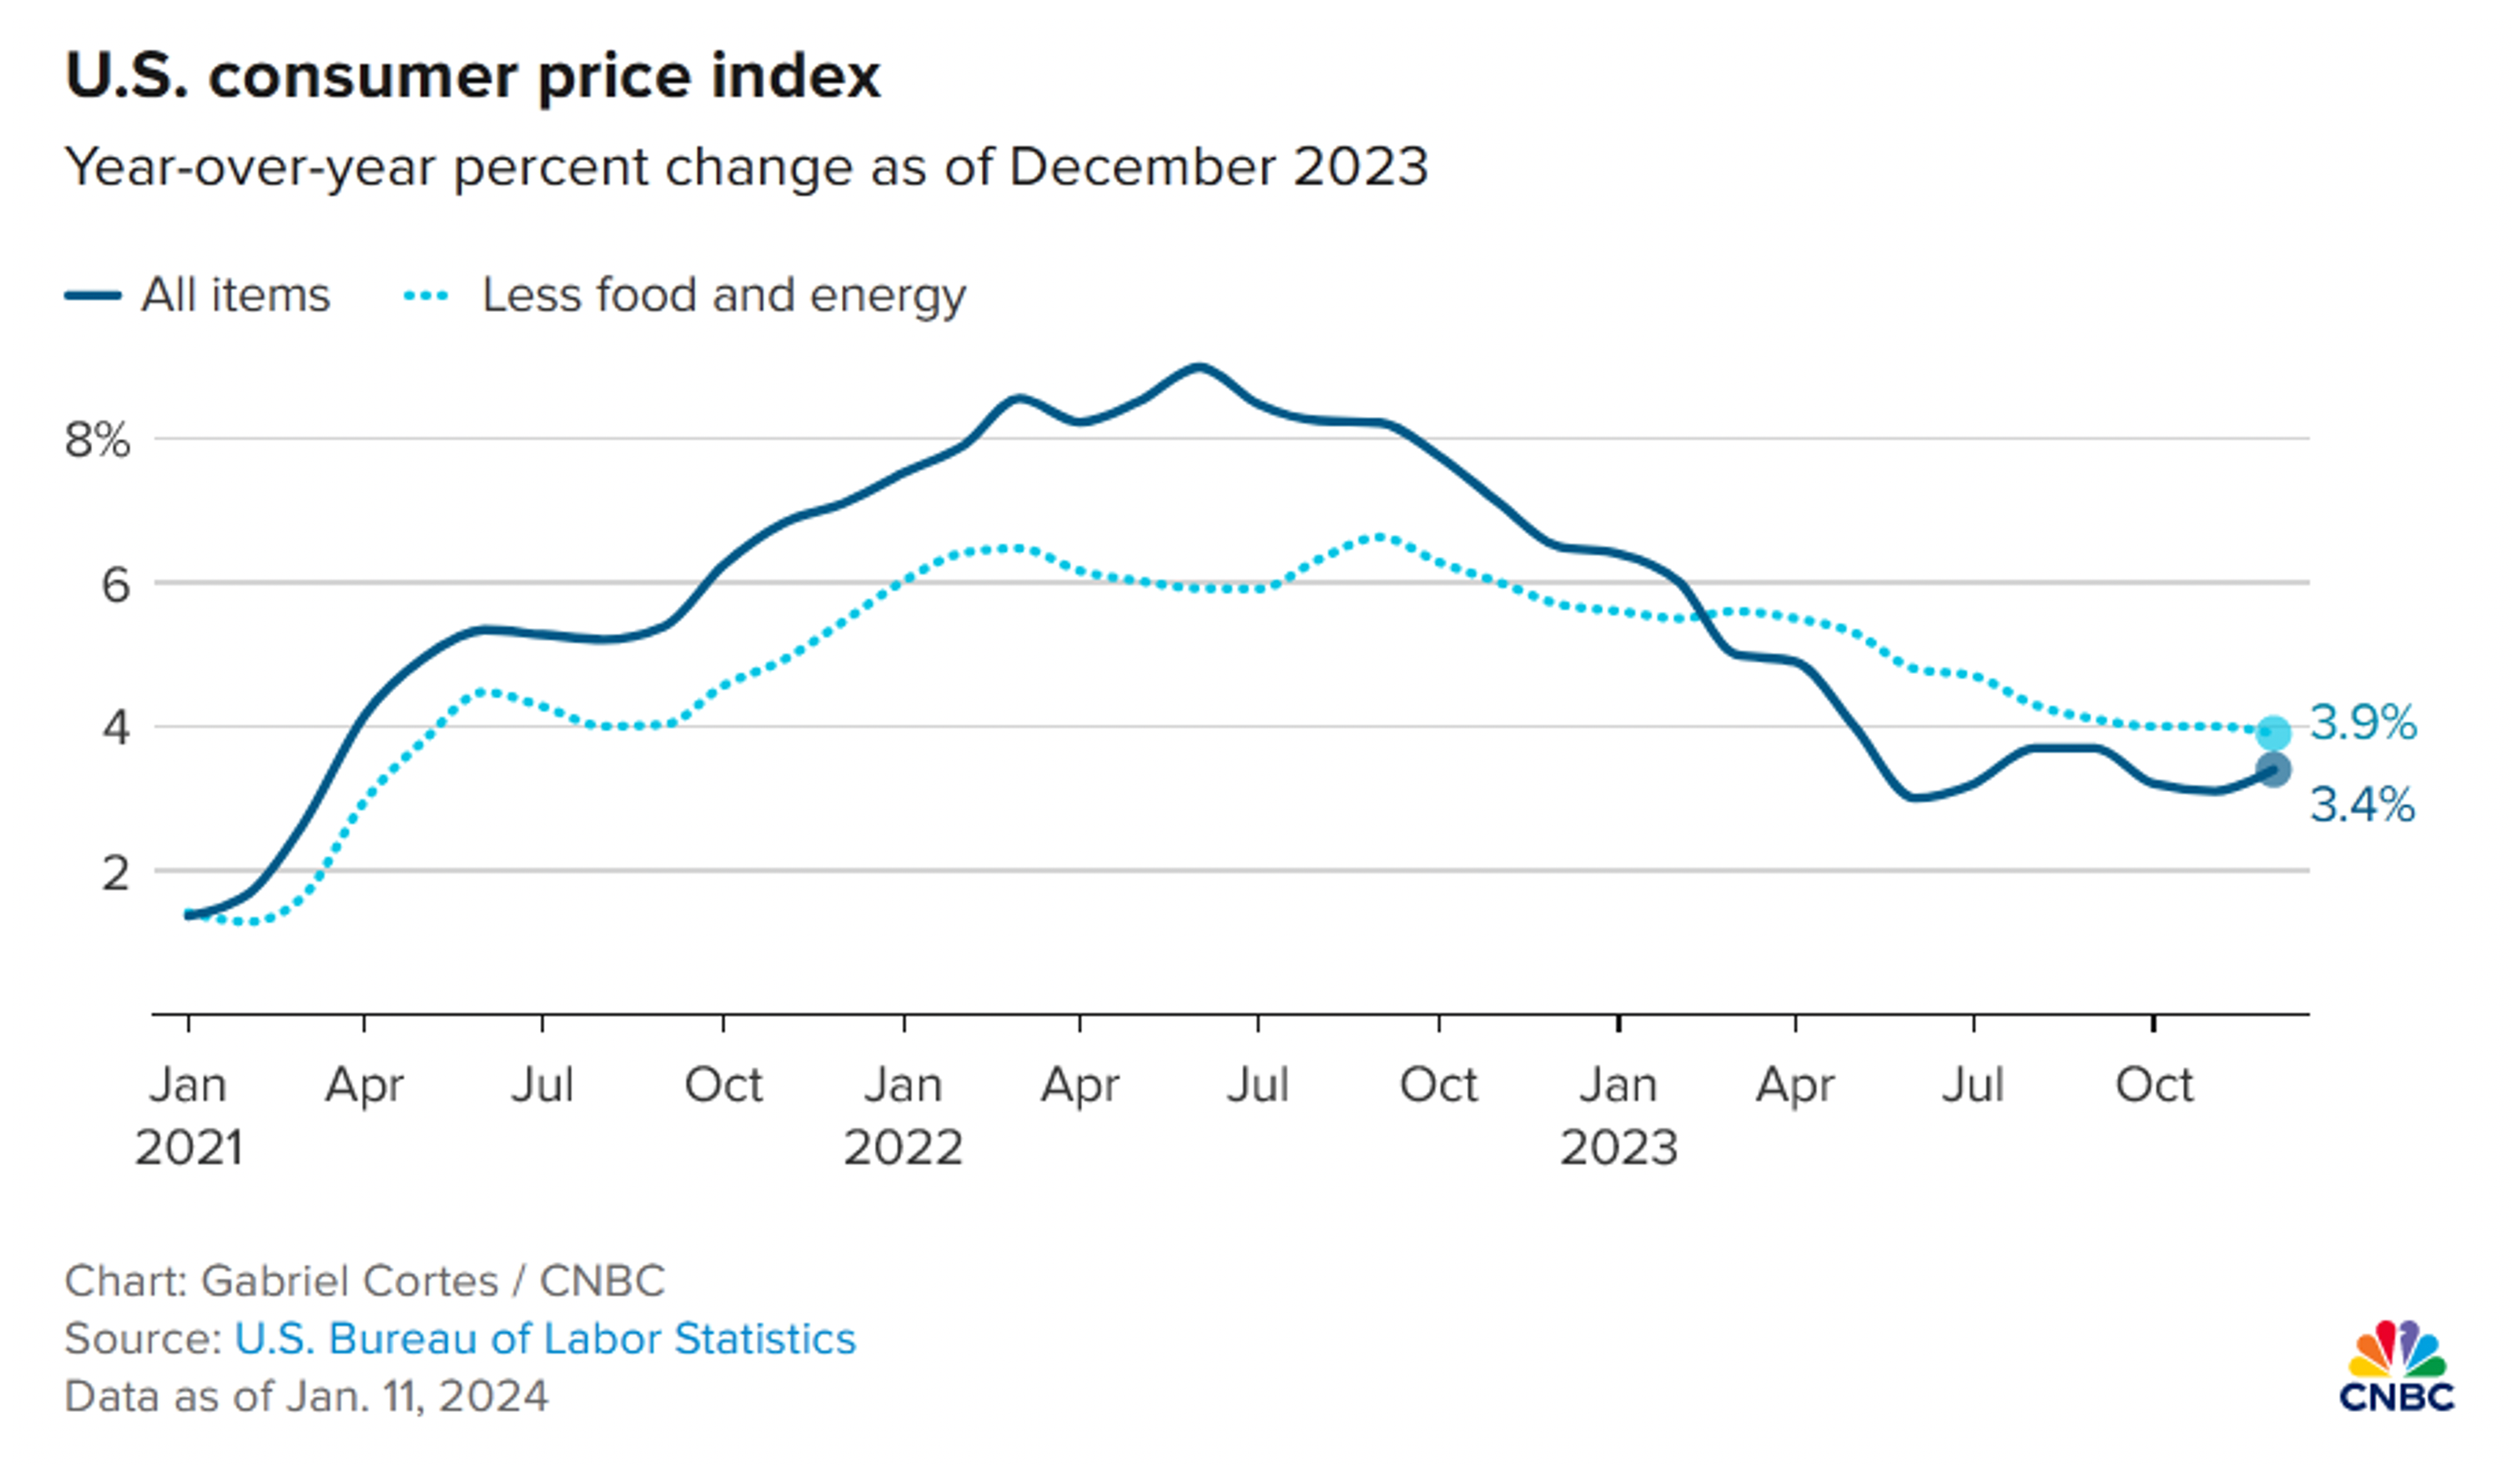
Headline and Core inflation in USA. Source: CNBC
Although if assumed inflation counting methodology unchanged during years, these numbers would be higher. What is the difference in between headline and core?
- Headline inflation (CPI) is measurement on basket of goods that includes among many, food and energy.
- Core inflation excludes prices of above two named categories due to their price volatility.
But headline inflation drop is caused by lowered prices on energy, especially gasoline, gas etc. Core inflation didn’t fall that much and on charts remain more flattened and persistent.
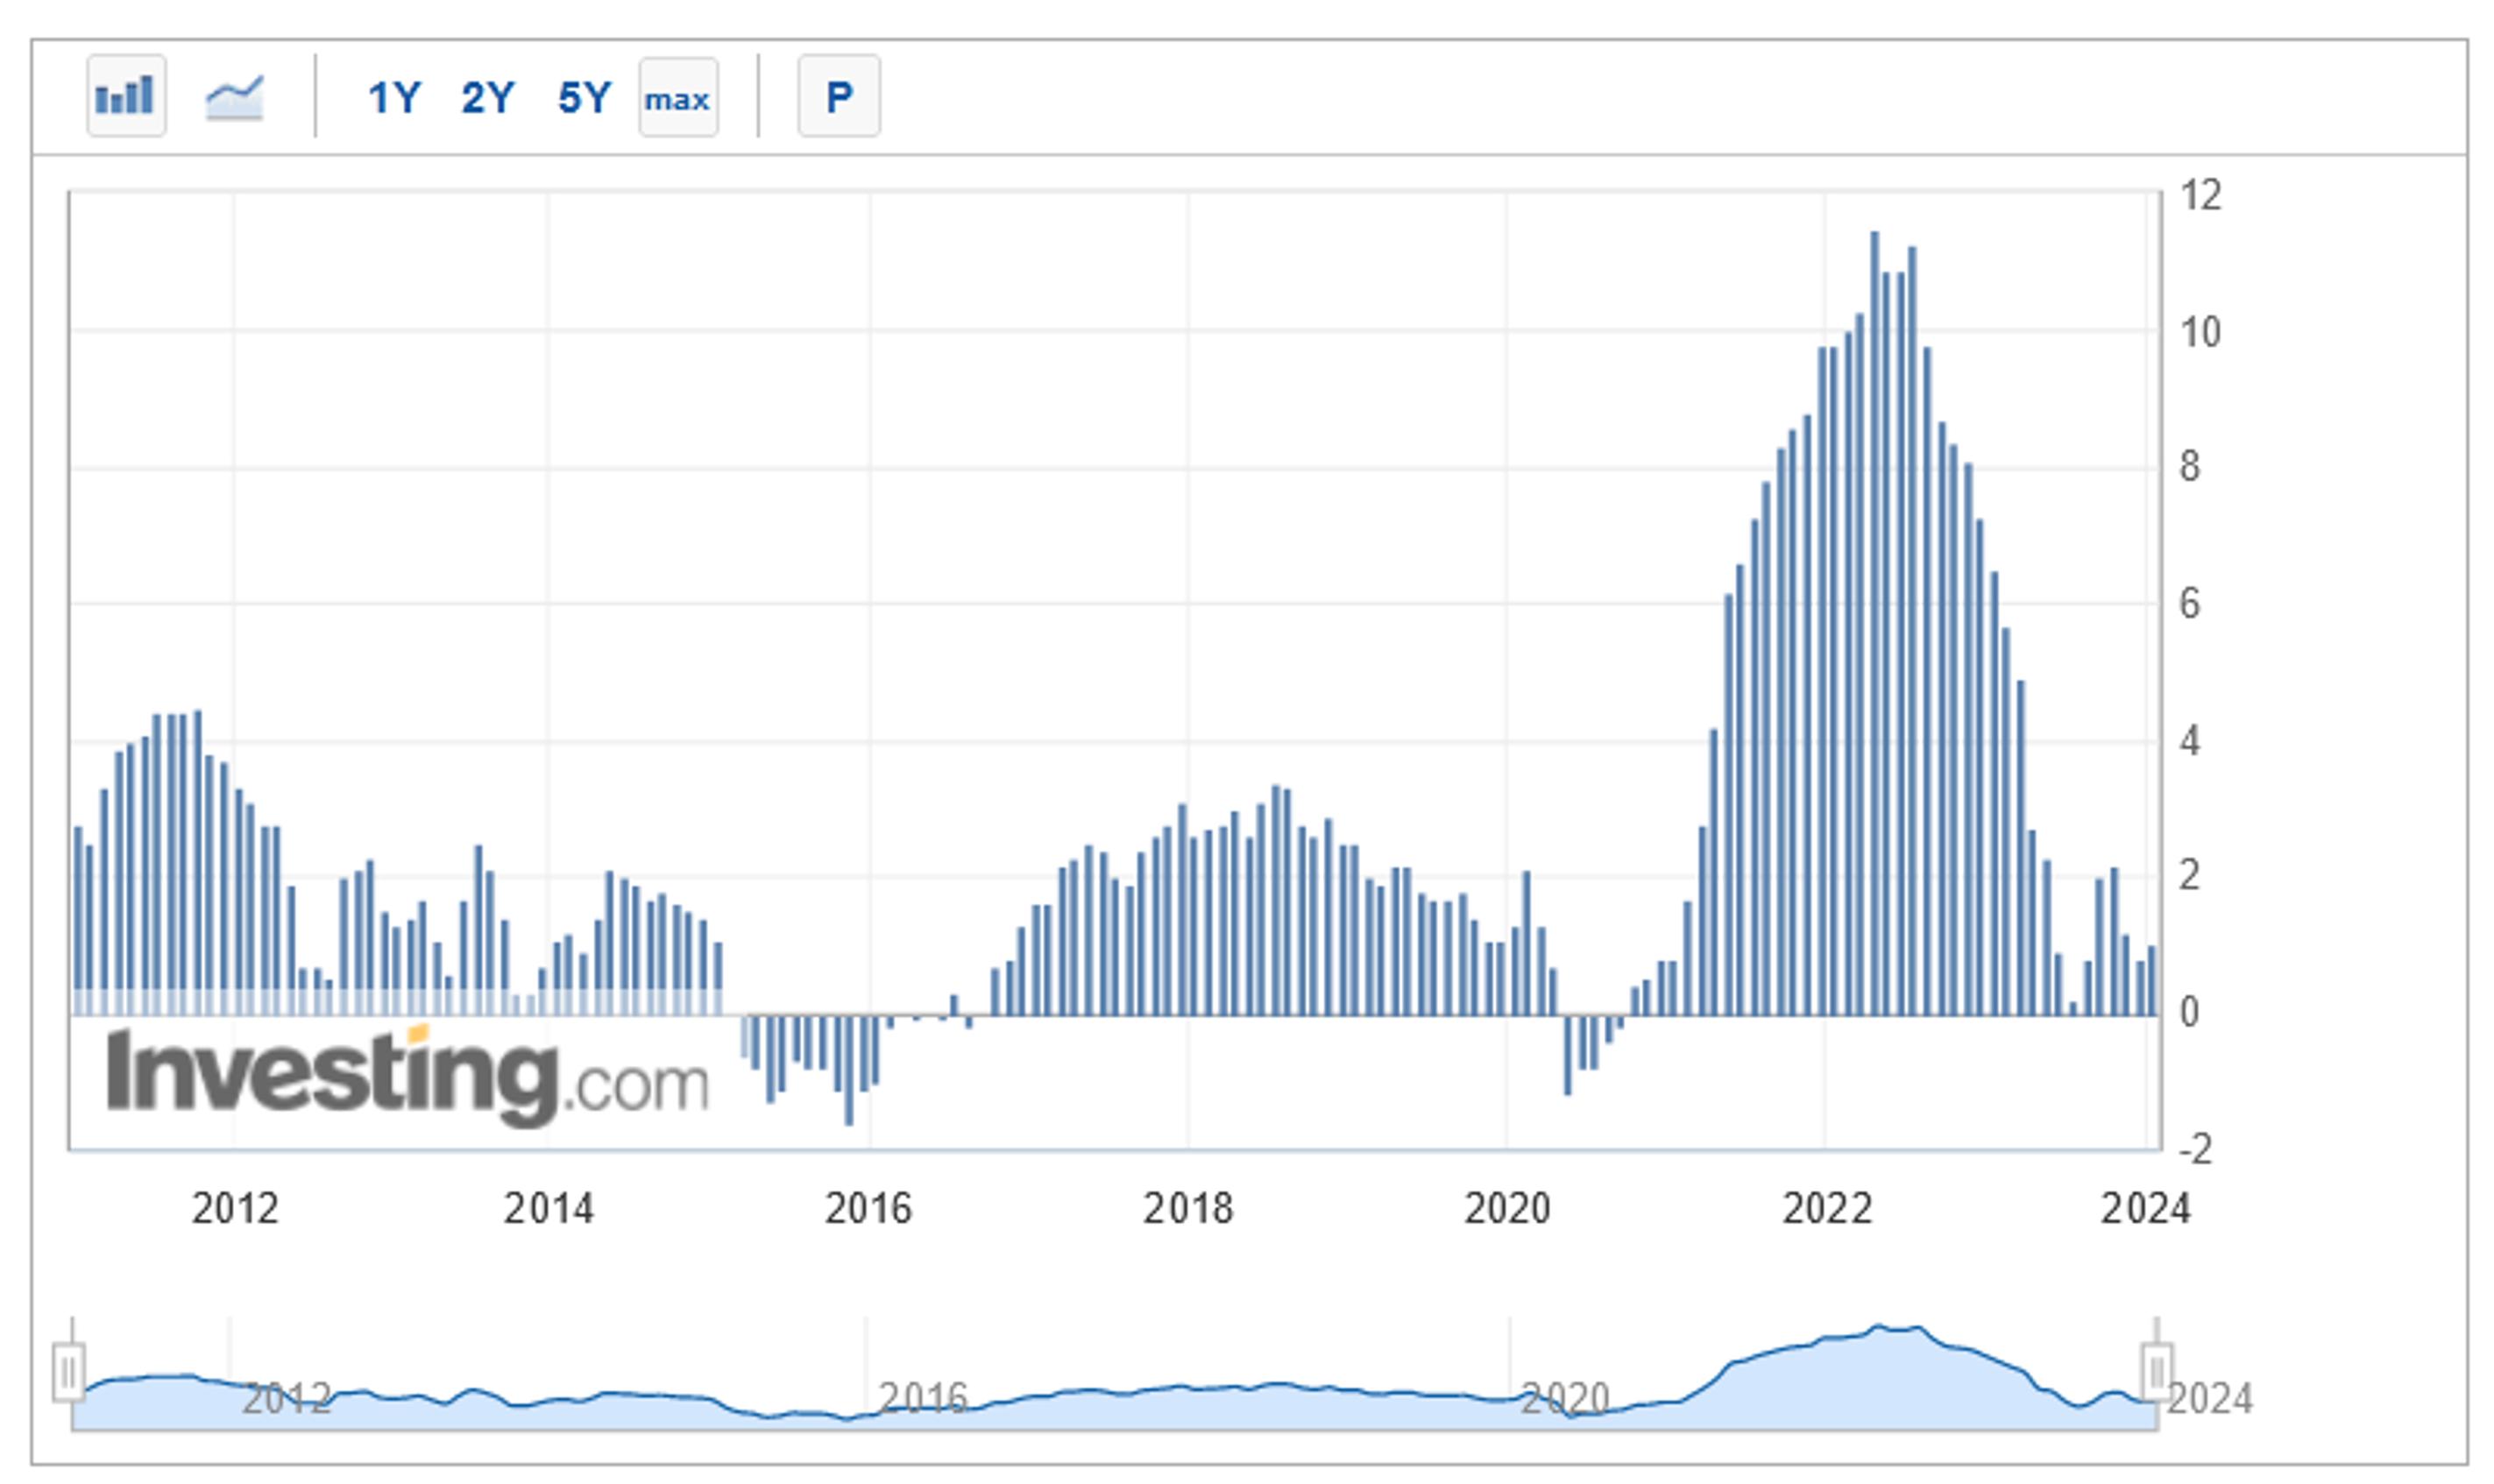
And of course, let’s not forgot about Producer Price Index. PPI measures costs of producing consumer goods, commodity and food prices directly affect retail pricing, PPI is considered as good pre-indicator of inflationary pressures. If input costs rise, some will be absorbed by producer and some (majority) passed on to the consumer. Conversely, if input costs fall, some of the decline will be enjoyed as wider profit margins by the producer and some will be passed on to the consumer in the form of lower prices. Again, PPI seems to be recently moderated.
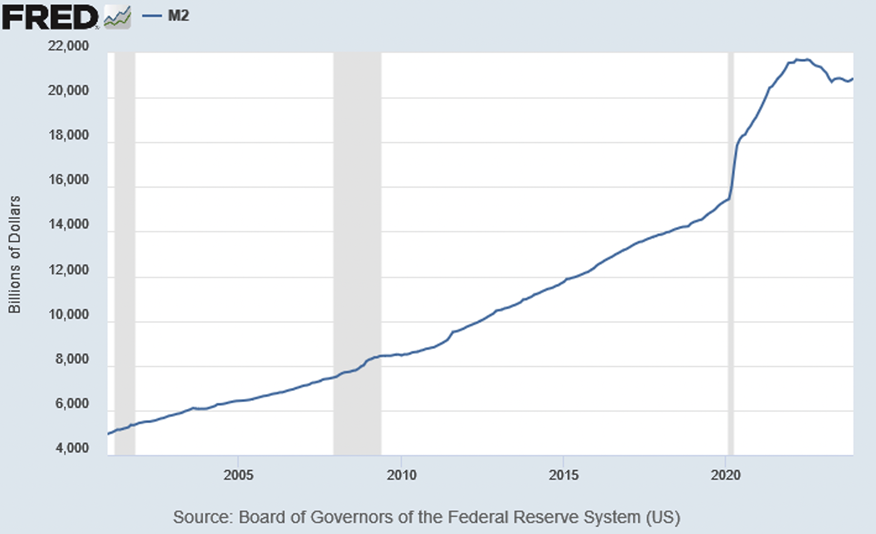
US M2 Source: https://fred.stlouisfed.org
Excess money liquidity in economy as measured by M aggregates had been moderated in case of USA and even dropped. Presented above M2 is the widest available aggregate for USA, as few years ago past decisions had been made to not to measure broadest M3. M2 measures US money stock that includes M1 (currency and coins held by the non-bank public, checkable deposits, and travelers’ checks) plus savings deposits (including money market deposit accounts), small time deposits under 100k USD, and shares in retail money market mutual funds. M2 is critical in understanding and forecasting money supply, inflation, and interest rates. Historically, when money supply dramatically increased in global economies, there would be a following dramatic increase in prices of goods and services, which would then follow monetary policy with the aim to maintain inflation levels low.
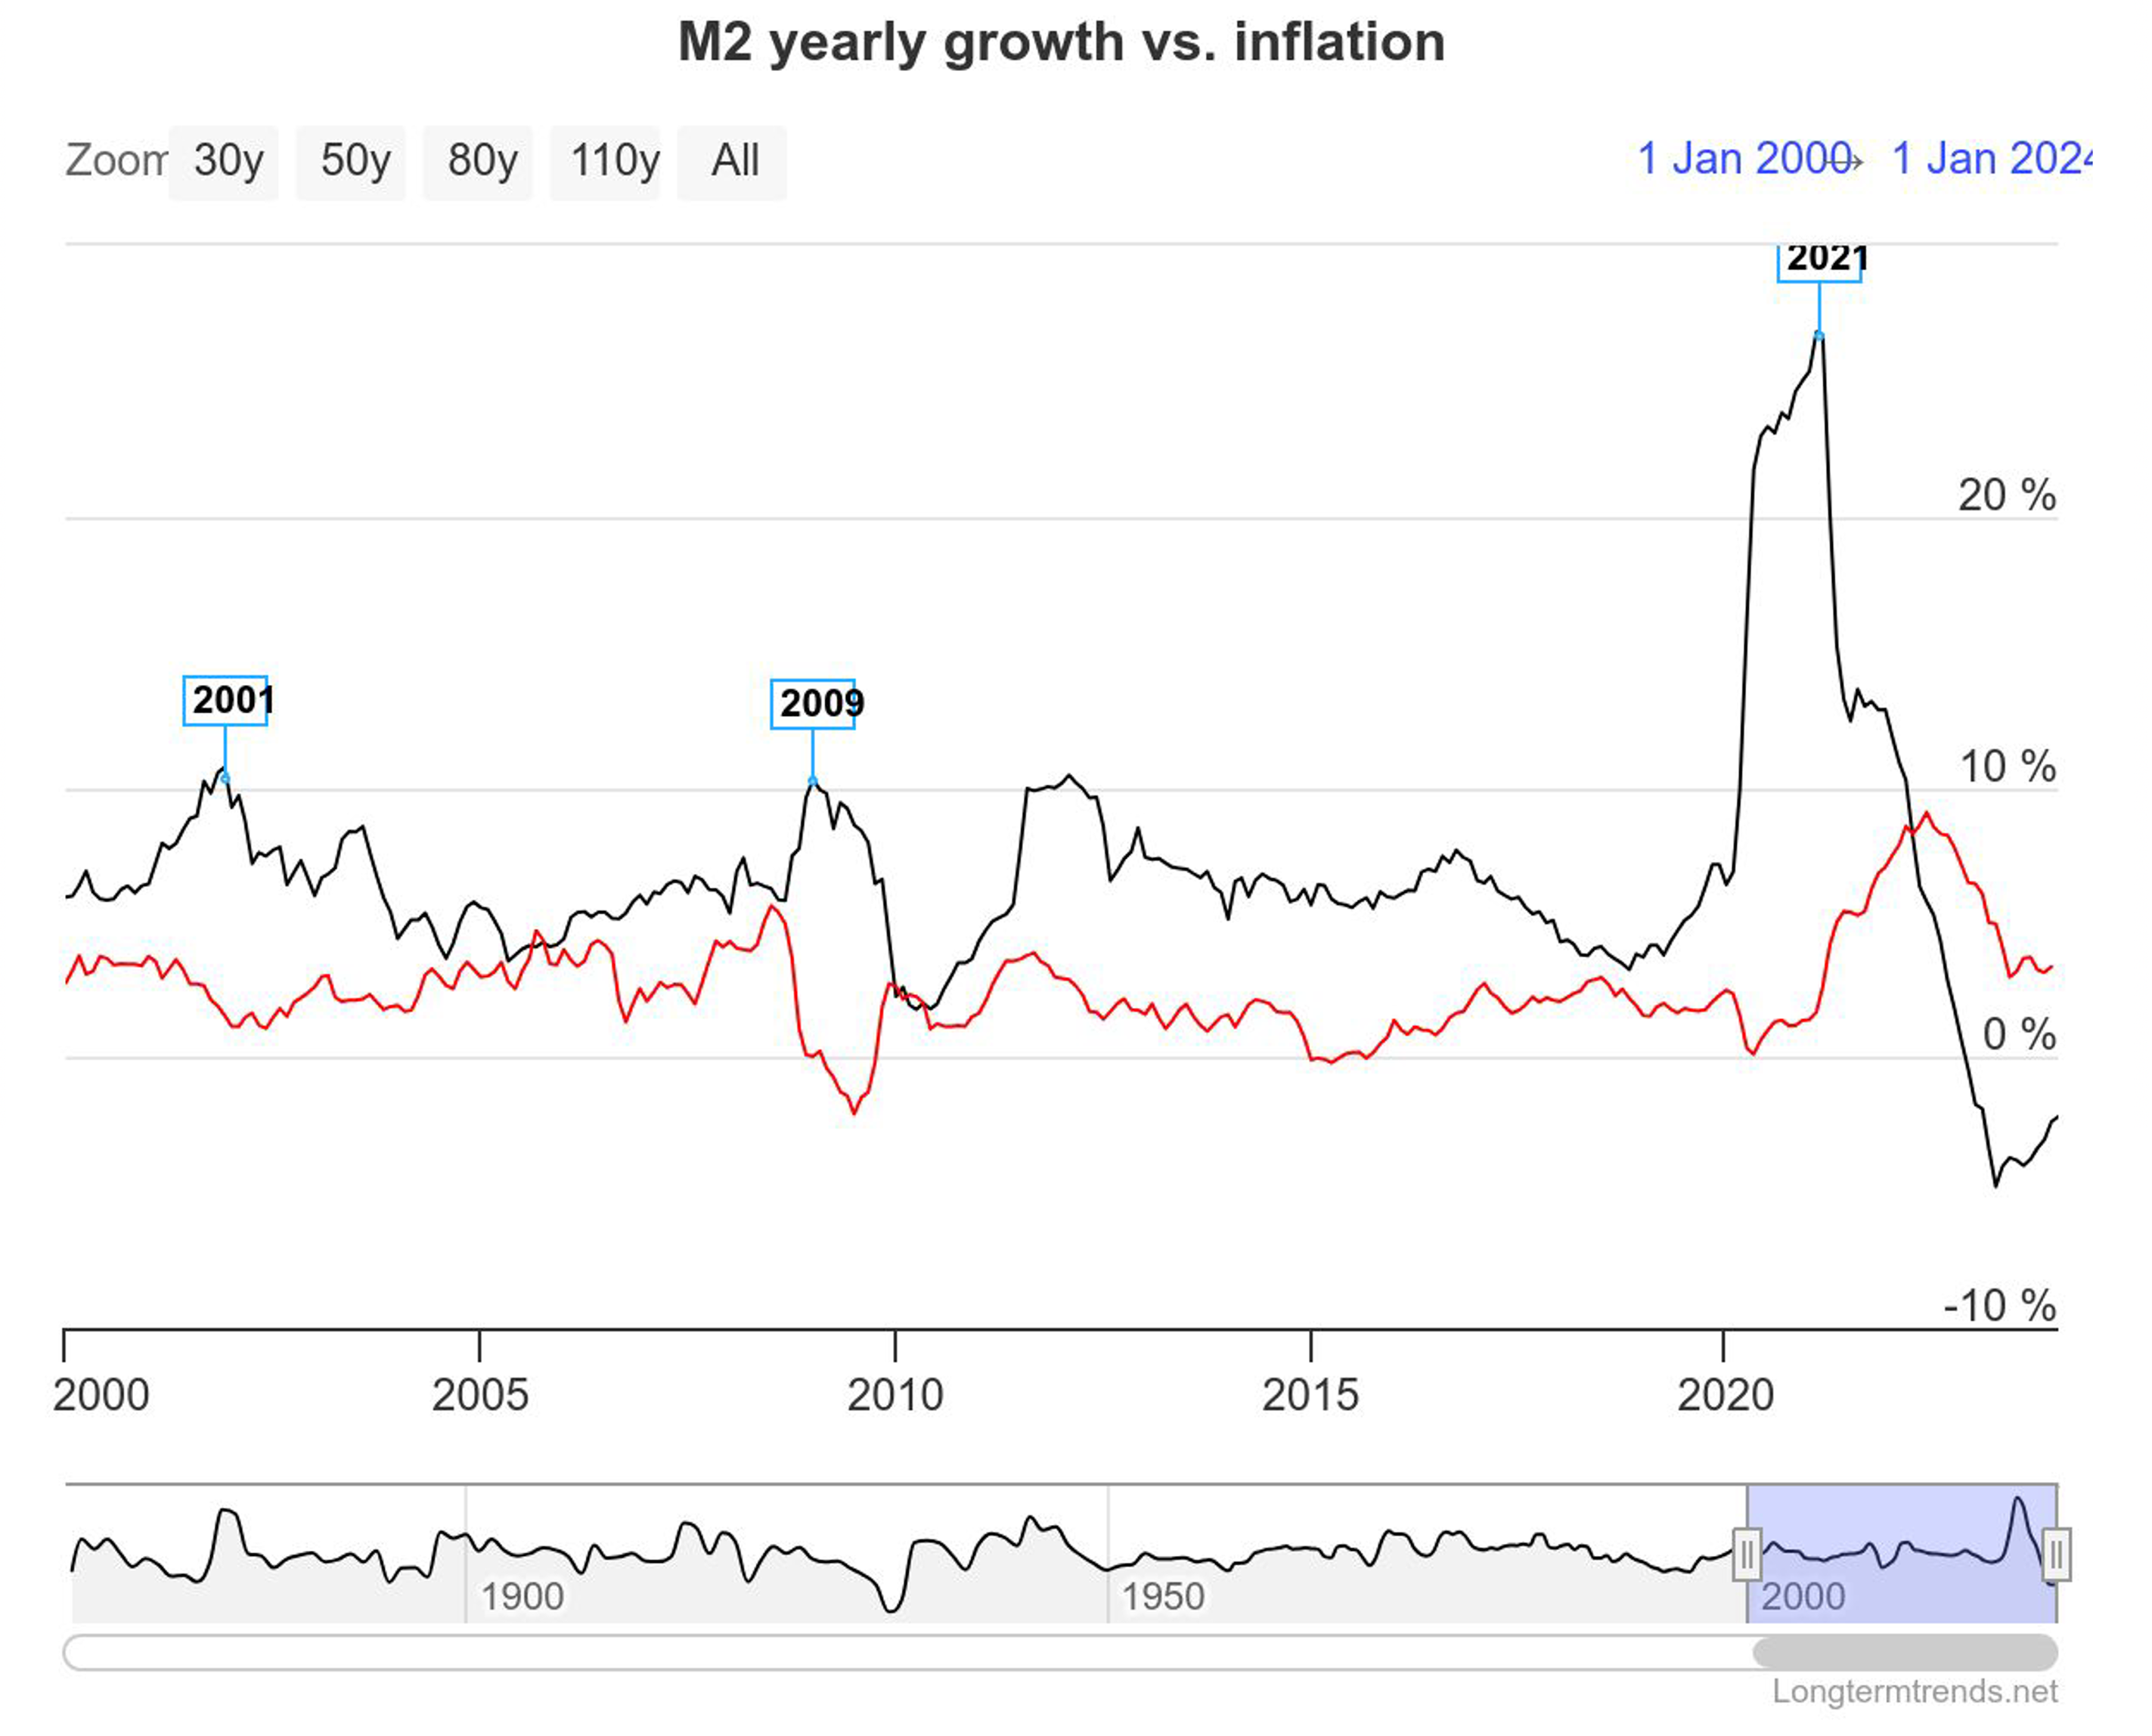
M2 Money Supply Growth vs. Inflation. Source: https://www.longtermtrends.net/m2-money-supply-vs-inflation/
Excess money liquidity in economy as measured by M aggregates had been moderated in case of USA and even dropped. Presented above M2 is the widest available aggregate for USA, as few years ago past decisions had been made to not to measure broadest M3. M2 measures US money stock that includes M1 (currency and coins held by the non-bank public, checkable deposits, and travelers’ checks) plus savings deposits (including money market deposit accounts), small time deposits under 100k USD, and shares in retail money market mutual funds.
M2 is critical in understanding and forecasting money supply, inflation, and interest rates. Historically, when money supply dramatically increased in global economies, there would be a following dramatic increase in prices of goods and services, which would then follow monetary policy with the aim to maintain inflation levels low.
M2 Money Supply Growth vs. Inflation. Source: https://www.longtermtrends.net/m2-money-supply-vs-inflation/
Above chart looks even more interesting, when divided in between main economical or financial superpowers.
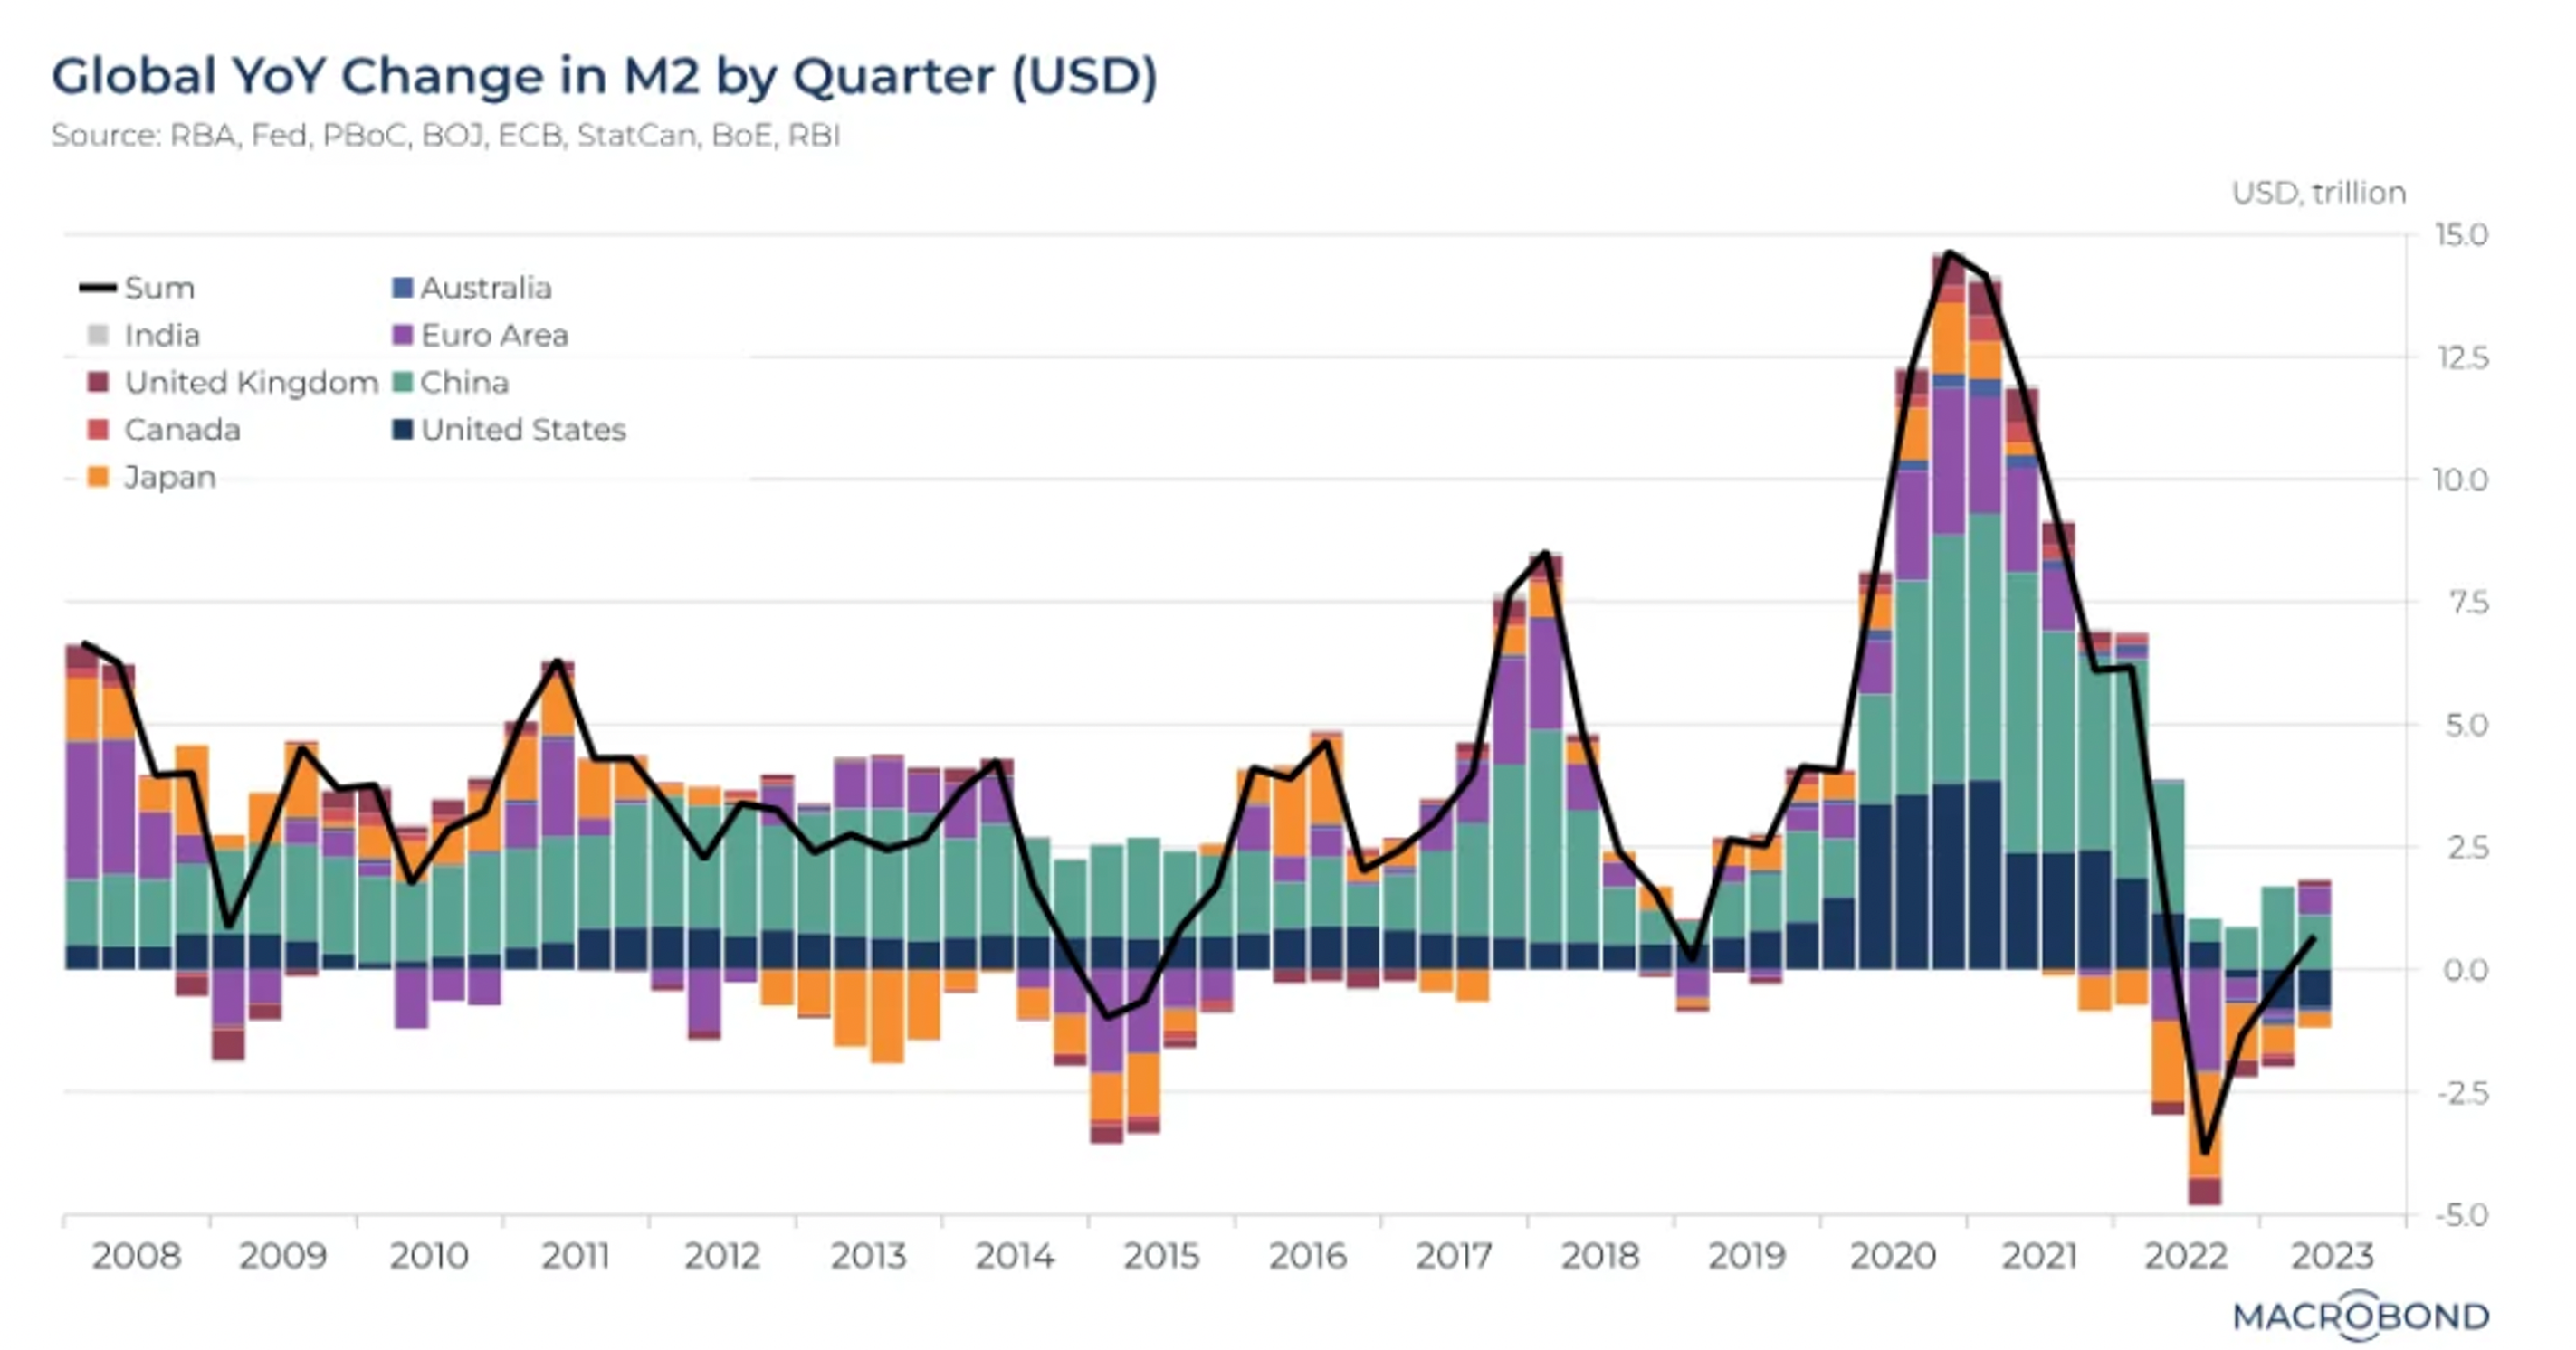
Global change in M2 by quarter, up to end of Q2 2023. Source: Macrobond
What would happen to inflation if crediting conditions will be loosened because of rate cuts? Inflation should re-appear, although moderated by deterioration of economic conditions. And so, it seems for majority of this decade we won’t see it at targeted by FED level of 2%. Instead, it may have tendency to go higher, although far from double digits. This however may be again tempered by deterioration of economic factors caused by possible recession.
What really helped in pushing inflation down, were relatively low prices of oil. That translates to near-recessionist or pre-recessionist drop on crude and gas demand, as goods’ production suffered and less fuel volumes were needed. In response to that OPEC kept cutting crude supply in the recent months, in attempt to maintain certain level of crude prices. On the other hand, USA increased its oil production, taking profits from elevated oil prices and in attempt to cool down fuels’ shocks i.e. in Europe. USA also attempts to purchase oil at 3 mln barrels per month in attempt to re-stock its strategic reserves (SPR), released in 2021 and 2022. And so, while oil prices attributed to inflationary pressures in 2022, this had cooled down in 2023 along with price drop. For majority of the year WTI – main crude index – kept moving within 70-80 USD range, going to 90’s late September-October 2023. Oil was going down upon majority of FED rate hikes and up upon news on incoming end of these – cannibalising future drop. Then in Q4 2023 it was OPEC & demand factors manly contributing to further drops on price. And let’s not forget on Middle East, which we’d focus on later..
Crude oil as inflationary / de-inflationary factor
In accountancy there are three main components attributable to our final cost, which are labour, materials and overheads. But would you ask anyone in production sector, it is energy being most important. In books it sits in overheads.
- Directly contributing to costs of product manufacturing – as there is need for power to run our machines or move goods between locations.
- But also in indirect costs, as all the non-production sections and customer servicing sections also require energy and heating. Energy is a ‘must be’ component, period.
Energia jest elementem, który "musi być", kropka.
In 2023 USA surpassed Saudi Arabia and Russia in crude oil production, achieving 13.3 mbpd, which is 1 mbpd more y/y. But while production is up, well performance is not, and higher pace of production depletes oilfields faster. Analogy would be having cold drink during summer heat. Would we have one straw, we’re able to enjoy it for longer. However, having three more straws inserted in same drink by our friends, with four of us sipping at the same time – this would empty our drink very fast. And that is the case for US crude oil. In first 3-4 years since opening oil wells in Permian will produce 75% of its lifetime capacity, then production will drop down. That is with assumption that wells on oilfield have distance of 1000 ft (300 m). However, to improve short and midterm production numbers, this is being shrank to 400-500 ft (150-120 m) and sometimes even to 100-200 ft. And so, we have more straws in one drink which basically means, wells cannibalise on each other’s future production. US crude production should therefore be maintained on similar levels at 2024-2025, however its capacities are very maxed out and sector generally suffers on long-term un-investments. Let’s not forget on this occasion on financing issues caused by political-ecological direction applied.
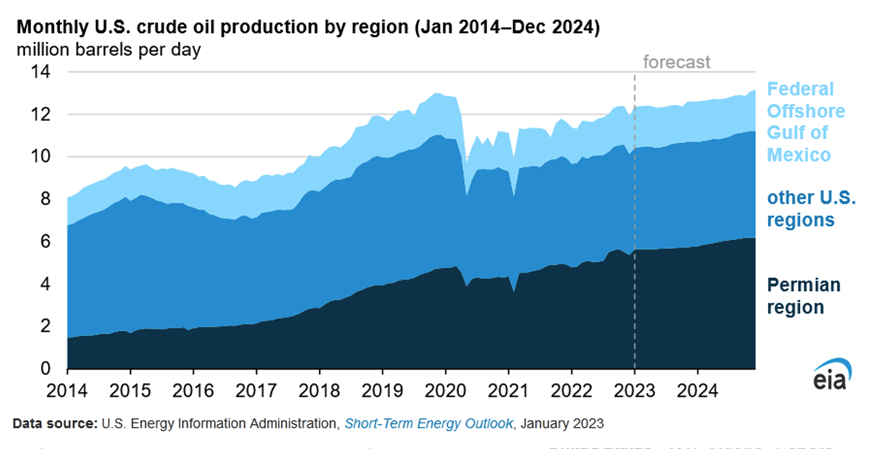
Monthly US crude oil production detailed. Source: EIA
What made USA top oil producer in the world? It is fracking and shale oil that contributed in the past to growth of US crude production from 4-5 mbpd to 13 mbpd. It is financial collapse of 2008 which effected in growth in price of oil. Higher prices made producers more open to risk in attempt to access more volumes. Shale revolution began and such direction has been initiated during Barrack Obama’s presidency and continued later. Effectively, with a help of some imported Canadian volumes USA turned from being global crude importer to exporter. This occurred during ‘Arab Spring’, which resulted in long-term civil wars in Libya, Syria, created mass and violent protests in Tunisia and Egypt among many and highly contributed to temporary raise in prominence of so-called Islamic State. Within couple of years USA filled the gap, even attributing to small oversupply. Considering recent and ongoing production cuts among OPEC and OPEC+, this also made USA largest crude oil producer on our planet.
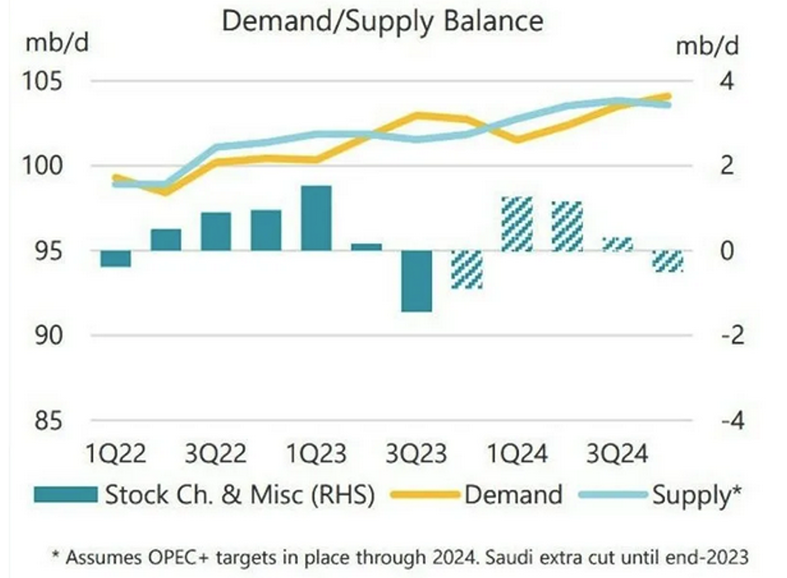
Crude Oil Demand / Supply balance as on end of Q3 2023. Source: Oil & Gas Journal
Conventional crude oil production (offshore, onshore) in USA is responsible for 32%, while remaining share is attributable to fracking and shale, which is prone to decline in some near future. However just sheer volume doesn’t mean that US is self-sufficient. Key lies in types of oil. We’ll try to avoid describing all types of crude, along with characterisation, as this is not the subject of the analysis, and hence to simplify that as much as possible. Most crude oil produced in USA is light/sweet type. Have we considered specifications of US produced WTI vs Russian Urals, one is light/sweet and the other is heavy/sour type of oil. WTI and Brent are considered as most perfect to refine onto gasoline or jet fuels. Heavier/sour types are perfect for other products like plastics, petrochemicals, other fuels and road surfacing. Heavy crude can also be refined into transportation fuels (diesel). Since the cost of crude oil is a refinery’s largest input cost and processing cheaper heavy crude into higher-value refined products usually improves a refinery’s profit margins.
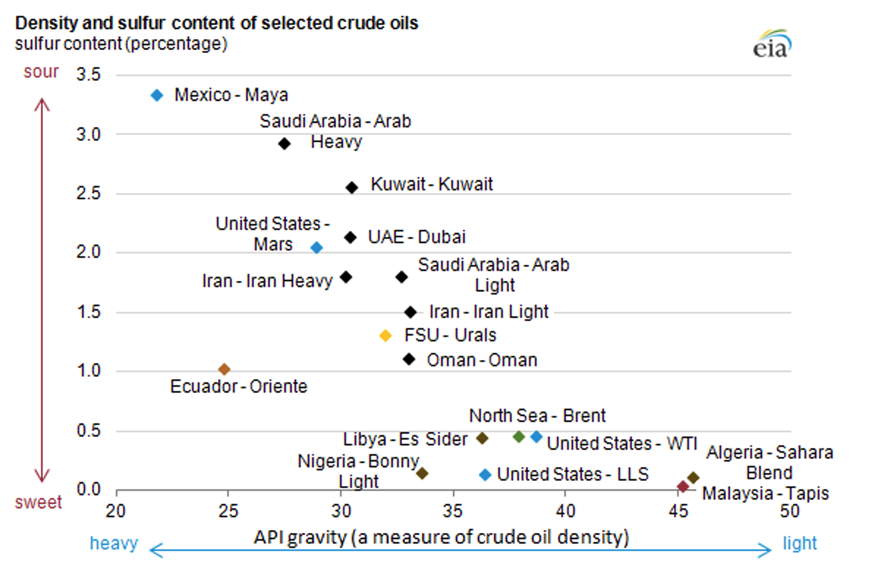
Base to understand differences in crude oil types. Source: EIA
US excels in light oil, and that is the main type of USA crude exports. At the same time USA imports heavy oil and its products. It is very similar in case of Europe, where Brent is being considered as like WTI in qualitative terms. Europe however suffers from different issue. Its crude domestic supply vs demand is unbalanced, with globally highest deficit, making Europe / EU most crude and gas imports dependent region in the world. Even with certain strategic reserves, our part of the world may be easily affected by supply issues. Like sudden swift from long-term supplier, or issues on maritime routs.
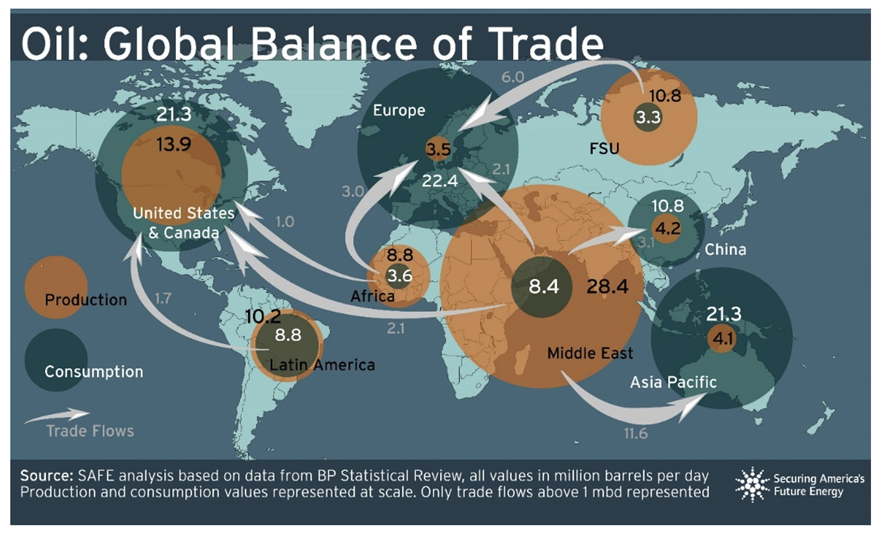
Map of regional imbalances on crude oil. Please be aware, that it shows data as per 2021, hence Russia remains direct supplier to Europe. However idea is to show imbalances between production and consumption, and who is most prone to oil related price shocks. Source: SAFE
And with that announcement, we move on to the thickest grey swansong of early 2024 which is...
Red Sea red alert
Interesting development occurred at Red Sea area, at its southern part to be more specific - Bab al-Mandab Strait and Gulf of Aden. Area in proximity to Horn of Africa, Djibouti, Eritrea and Yemen. If handled incorrectly may turn into major inflation-making issue, affecting especially Europe, but not only.
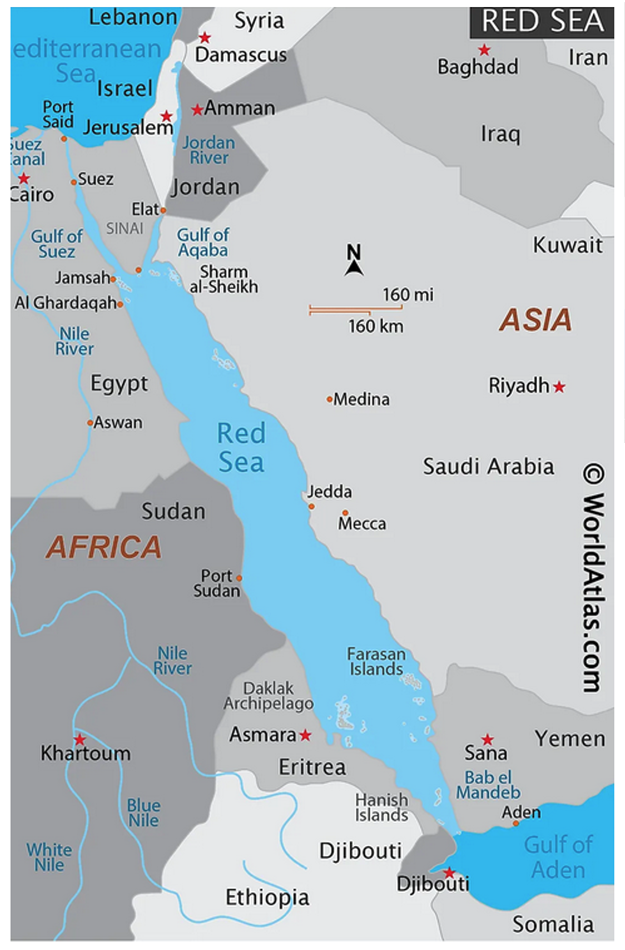
Red Sea region. Source: https://www.worldatlas.com/seas/red-sea.html
In the recent weeks, Yemeni Houthis started to attack ships passing through Bab al-Mandab Strait. Initially they aimed for Israeli “any way connected” vessels, then everything with exception of Chinese and Russian vessel. Then eventually on 26th January they performed missile attack on tanker with Russian oil. Although it is possible that it was just a ‘mistake’, as tanker “Martin Luanda” belonged to a company registered in London. Attacks affect Red Sea maritime route, which is considered as one of the busiest and most important in the world, as may be considered as a gateway to Europe for Mid-Eastern gas and oil supplies to Europe. It even grown in importance since 2022, when Russia invaded Ukraine. Since then, certain measures affecting local flow of hydrocarbons had been undertaken, making Red Sea even busier than before.
Europe and especially Germany were natural direction for Russian energy flows since the time of original cold war and USSR. This was being done predominantly via pipelines, however in time oil tankers prevailed vastly as means of delivery and diversification. And so located on west of Russia Primorsk, Ust-Luga, Murmansk and Novorossiysk have much higher export capacity than located in Far East Kozmino and Prigorodnoye. Since 2022, Russian oil is being directed to Asia, where it either becomes utilised locally or mixed with similar blends or refined. In case of last two points, it then becomes exported i.e. from India or UAE to i.e. Europe which is in line with sanctions that state: product refined outside Russia, is no longer Russian. What is most important for us - both ways transport occurs via Red Sea. With geopolitical reversal from Russian oil, Europe imports higher volumes of oil from Mid-East region (same applicable to natural gas).
Overall, 5-6 mbpd of various origin (about half of this volume comes from Russian ports) cross Bab al-Mandab Strait on its way to Asia. This includes among many certain volumes of crude from Port Sudan located half way at the Red Sea. In other direction, there is over 6 mbpd travelling up north. And again, there is more volume leaving sea than entering, as Saudis export significant volumes of oil from its port in Jeddah located half way of Red Sea.
So Bab al-Mandab Strait Red Sea and Suez Canal became even more important than before. This finds confirmation in numbers, as 2023 is considered record in terms of number of tankers on this maritime route and revenue of ‘freighters’. Additionally, more ‘green’ tech and overall goods is being transported via Red Sea. Minerals and materials travel to China or Malesia, where are being turn onto products, with certain number of these travelling back to Europe.
There were certain concerns over safety of this route when Israel-Palestinian conflict erupted. However Gaza Strip was located in certain distance from Suez Canal and conflict itself remained more “local”. However in case of Houtis impact is significant. One of the entities significantly affected by this situation is Egypt. During just first 11 days of 2024 it has lost over 40% of Suez revenues, which has importance. With unresolved conflict in Gaza, inflationary pressures on Egyptian pound and now issues on Red Sea, and food security dependent of major local grain exporters (Ukraine and Russia) seems that country sits on a barrel of gunpowder.
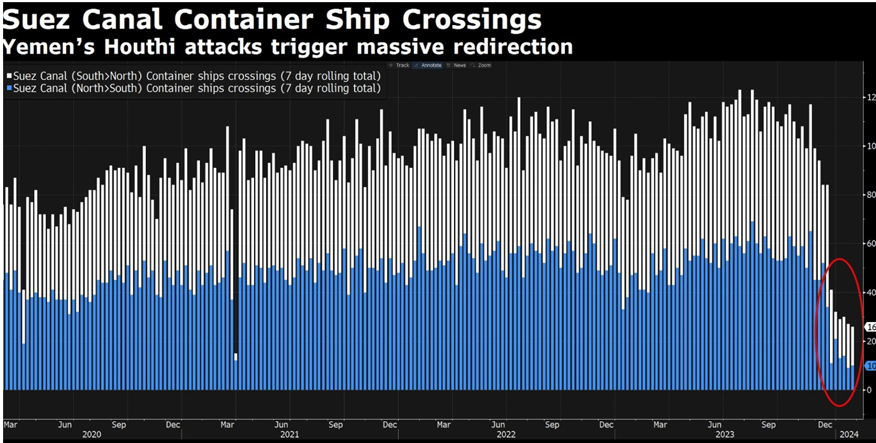
Suez Canal container ship crossings succumbed. Source: https://twitter.com/TheStalwart/status/1750160990187012203
Tankers and other transport ships decide to make a detour around Africa, to avoid dangerous area. But not all - on 24th January incoming LNG delivery from Qatar to Italy has been cancelled, as a first of its kind.
Of course, this subsequently uplifted product tanker tonne demand. Clarkson’s estimates tonne-mile demand rerouting via the Cape of Good Hope by shipping sector. This adds additional price on top of ban on Russian oil products, which already uplifted tanker tonne-mile demand by 5-6%. Add to that increased insurance, service costs etc. and as a result, cost to ship 40 feet long container from China to Europe grows by 260% within just month.
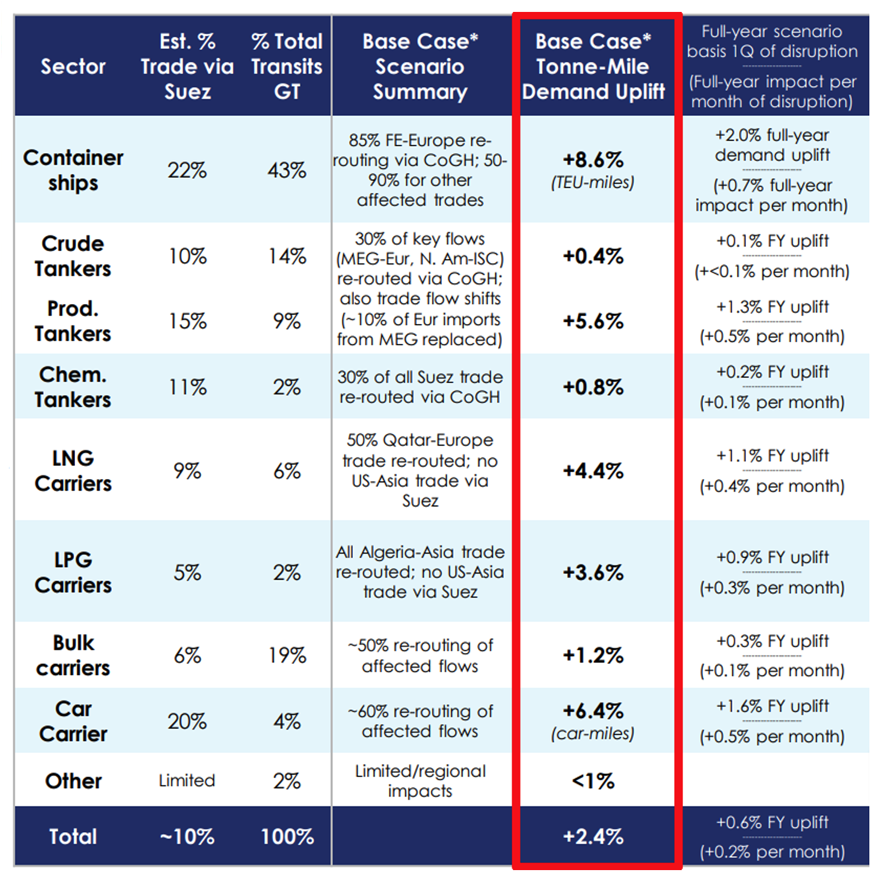
Clarkson’s estimated tonne-mile demand rerouting via the Cape of Good Hope by shipping sector. Source: Clarkson’s
Had this persist long-term, freight and insurance costs may eventually become inflation-fuelling for European customers. At the same time, price of contracted crude and products may remain same or increase just slightly. And so, sector would remain stone cold calm but observant, but it will be investors and traders with options and futures exposure on oil, who will remain stressed. And final customer even in stagflationary condition.
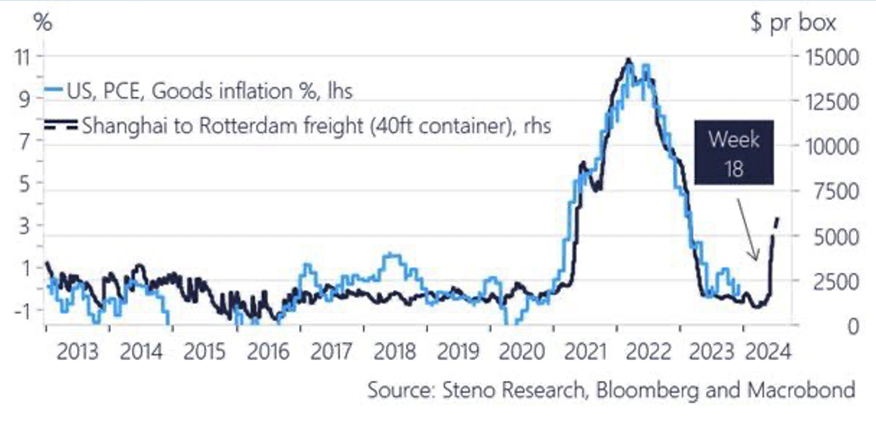
International freight rates vs goods inflation. Source: https://twitter.com/JanGold_/status/1749162226827608192
USA and UK decided to counter situation by airstrikes on rebels and fleet presence in the region. USA is already present militarily in the region since decades. However it seems that land-intervention to topple down regime are out of the question. Saudi Arabia along with vast coalition consisting majority of Arab Peninsula, with assistance of France and UK, fought against Houthis for many years, only to be repelled. Bahraini and UAE – part of said coalition, also were inflicted heavy losses in Yemen. In addition, in the past, rebels attempted many successful strikes on Saudi refineries. Nowadays with energy related tensions such attack could really affect markets and production capacities. Al-Rijad would then prefer not to be dragged into the same once again. Similar thing with Egypt, which in the 60’s decided to intervene in Yemeni matters. Until now Yemen is perceived by Egyptians same way, as Vietnam to Americans.
Especially since radicalisation of Houthis lean towards stance presented by Hezbollah or Islamic State, and close relationship with Iran are no secret. And it is not exaggeration from our side, just words of Professor of Near-East Studies at Princeton university – Prof. Bernard Haykel.
Problem is that markets perceive airstrikes performed by coalition forces as a form of necessary action, but still an escalation in the region. And so Bab al-Mandab Strait is now only safe to those, that Houthis perceive as not-enemies. But others have to continue on traditional and historical route of Vasco da Gama.
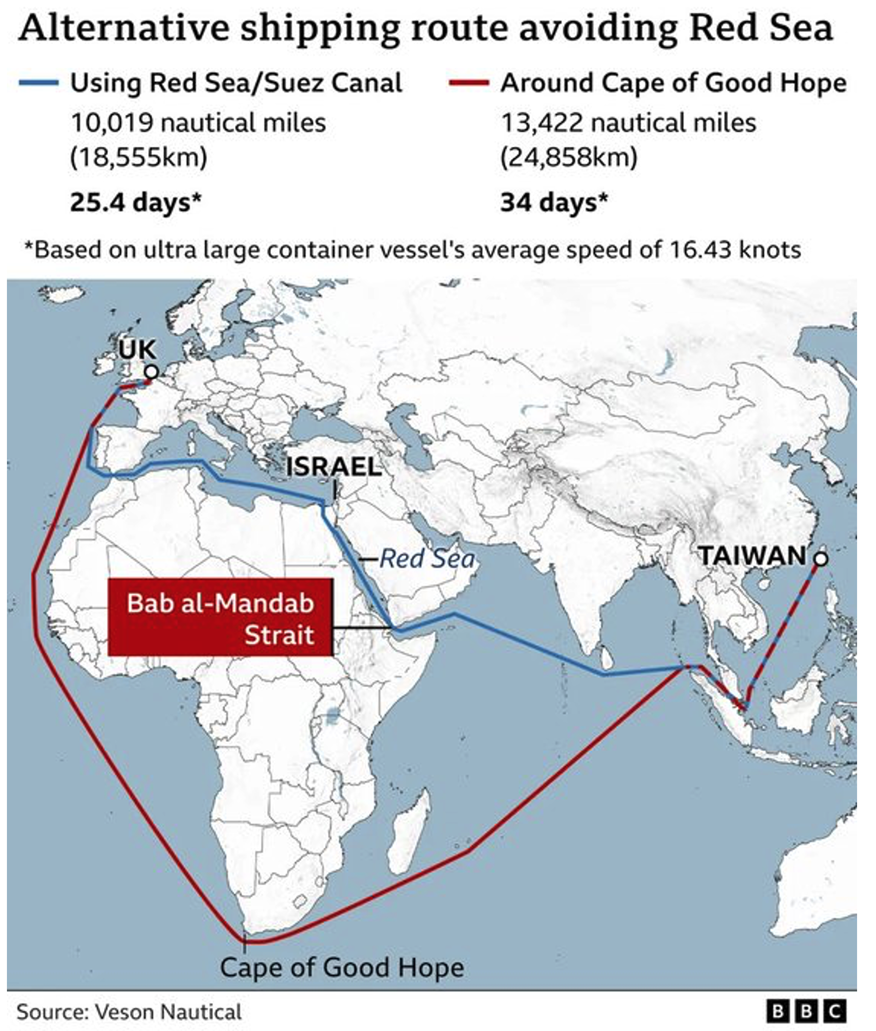
Red Sea vs Cape of Good Hope route from Taiwan to UK in length. Source: BBC
Subject of 2024 swans and finally outlook on gold and other precious metals will be covered in third and final part.
To be continued…